
Radar provides a great deal of information, most of which is beyond the scope of this class. Read Vasquez Chapter 8.
Radar shows us precipitation in the atmosphere. Where there is precipitation, we know there is moisture combined with lift, with both being sufficient to form not just clouds, but also precipitation. The patterns and inensities of precipitation are very important clues to the structure and evolution of weather systems.
A radar site sends out a beam of electromagnetic radiation, and measures the intensity of the reflection (echo) of that beam. This intensity is given in units of "DBZ", which is a logarithmic scale. There is a fairly good relationship between DBZ values and intensity of precipitation.
A radar unit also measure the time it takes for the reflection to return -- this gives the distance of the echo.
NEXRAD radar sites also measure the speed of the radar echo -- this is "dopplar radar". The radar can only measure the speed the echo is moving towards or away from the radar site. The component of the motion sideways to the radar is not measured.
The radar beam spreads out with distance. Thus the detail the radar shows is reduced with distance. The radar beam is also pointed slightly above horizontal. Thus as the beam gets further from the radar site, it is further above the ground. At large distances from the radar site, it is quite common for precipitiation forming in lower levels to be measured incorrectly, or not at all. Intense rainfall close to the station my result in echoes further from the station being incorrectly measured (attenuation). Terrain (mountains) may block the radar beam in certain directions.
Ground clutter is a term applied to radar echos that are not precipitation. Ground clutter is usually close to the radar site. It is echos from buildings, birds, insects, airplanes, dust, etc. During bird migrations, ground clutter from birds can be extensive.
Anomalous Propagation (AP) is when the atmospheric conditions result in the radar beam being refracted down to the ground, and then reflected back to the radar. This can happen when there are strong inversions. These echos can be very strong.
Composite radar products combine radar returns from multiple radar sites. These are extremely valuable products for seeing precipitation over entire regions and comparing precipitation patterns with other weather charts (surface and upper air). But several things must be kept in mind when using these products. Areas on the composite chart that are far from any radar site will likely not be properly measured by any site. The radar data from one site is likely not at quite the same time as radar data from an adjacent site (+- 5 minutes). The compositing algorithms take these issues into account to some exent.
Animations of composite radar products can be especially valuable for understanding how a weather system is evolving.
Below is a map of the NEXRAD sites in CONUS. Note the areas distant from a radar site, where the beam becomes high above the ground. The map also shows areas where terrain is blocking the beam.
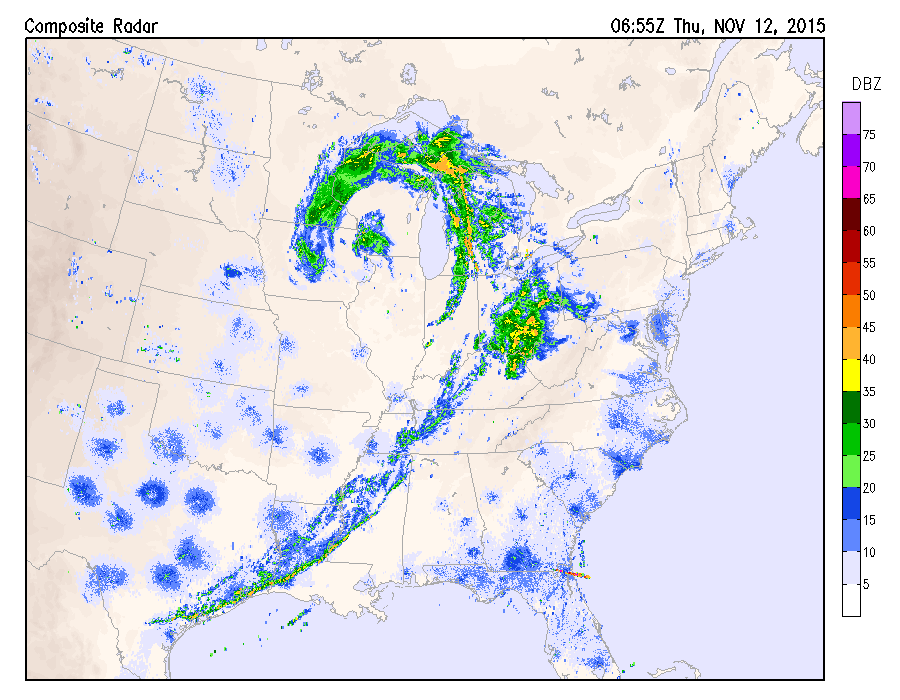
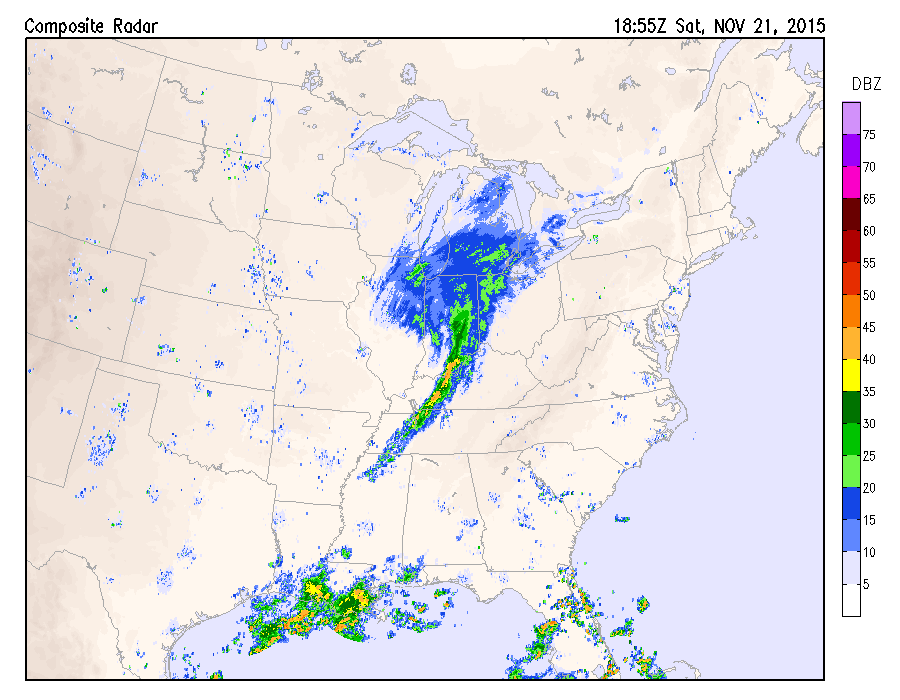
The composite products below show typical radar returns for strong extratropical cyclones over the midwest. Note the comma shape, and the trailing frontal precip band. Also note the extensive ground clutter. The 2nd system had snow in its northern extent. It's radar pattern is not as extensive, largely due to a relative lack of moisture flow into the system.
Below is an example of strong Anomalous Propagation (AP). Comparing radar echos to surface observations readily show that the strong echoes over Indiana are not showing precip.

An example of the dopplar radar view of frontal-band precip:


Radar animations will show many things not readily obvious from a station image.
Radar animation of the passage of a front with frontal-band precip: CLICK HERE
Radar animation of "snowmageddon": CLICK HERE
Radar animation of "Irene": CLICK HERE
Radar animation of an Oklahoma outbreak along a dry line: CLICK HERE
Radar animation of a midwest mesolow and bow echo: CLICK HERE
Radar animation of the 27 April 2011 outbreak: CLICK HERE
Radar animation of the 29 June 2012 Derecho: CLICK HERE
Radar is very valuable for tracking severe thunderstorms. The images below are taken from two different tornado outbreaks. They are screen shots of the radar reports available on the internet from weather.gov. Note the hook echoes, indicating possible tornadoes. Also note that very strong radar echoes, showing the "purple" color (>60 DBZ) are almost certainly hail.


