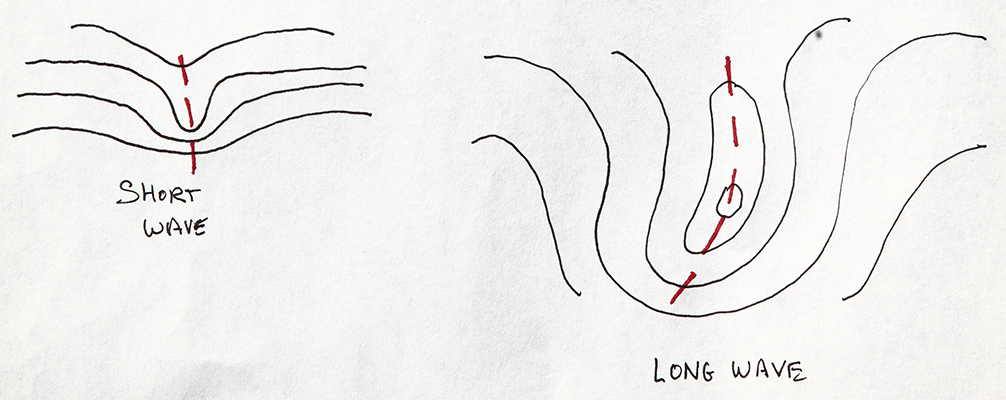
When looking at the weather maps, particularly the 500mb level (mid-tropospheric level), we see weather systems at many scales. Below are examples of a short wave and a long wave.
An example of combining waves at this scale is shown below:
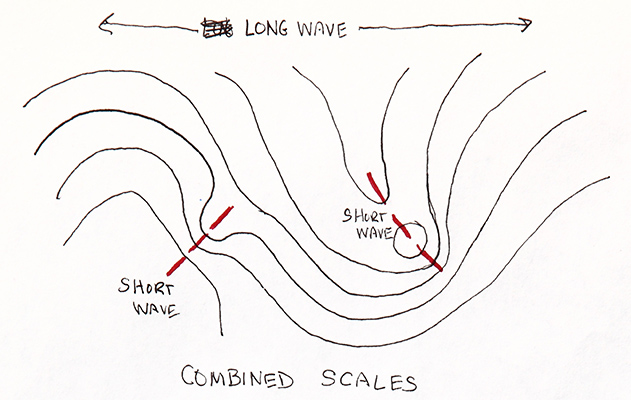
In the real world, there are waves and systems at all scales, interacting in various ways. This is one of the things that can make understaing of the charts difficult.
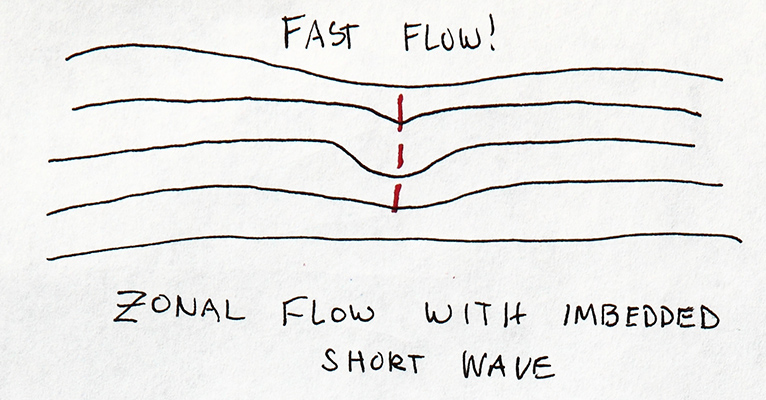
The general flow also is described in terms of zonal or non-zonal. Below is an idealized example of zonal flow, with a small short wave imbedded in the flow. In such situations, the short wave will be moving very fast.
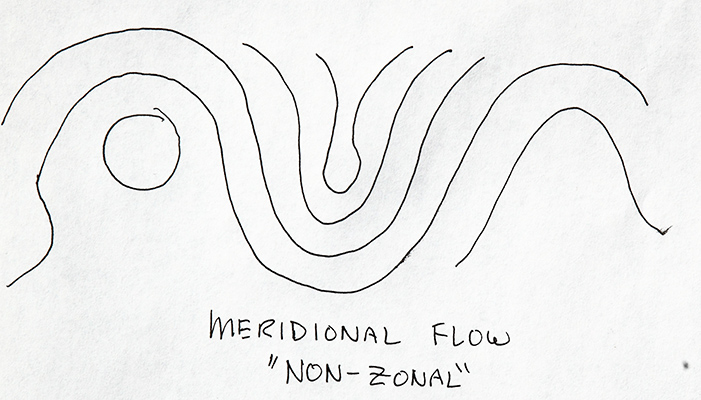
When the longer waves form very deep troughs and ridges, as shown below, this is called non-zonal flow or meridional flow. It is sometimes referred to as high-amplitude flow.
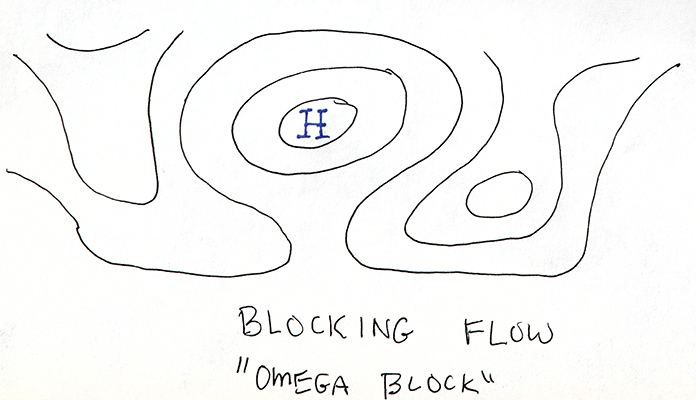
In extreme cases, the flow becomes blocked. Blocking flow is usually characterized by a deep anti-cyclone aloft in the mid-latitudes.
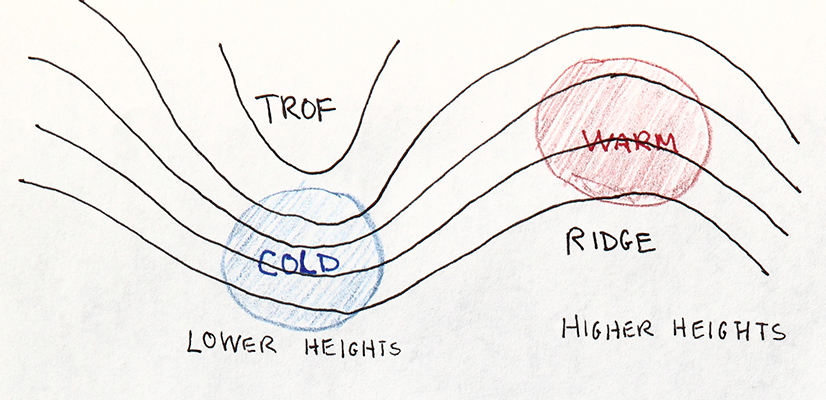
When looking at the typical large scale ridge and trough pattern on the 500mb chart, one can mentally apply the hypsometric equation, and observe that generally, a trough, being lower heights, represents a cold mean temperature below 500mb. The ridge, having high heights, represents relatively higher mean temperatures below 500mb (while generally true, there are exceptions).
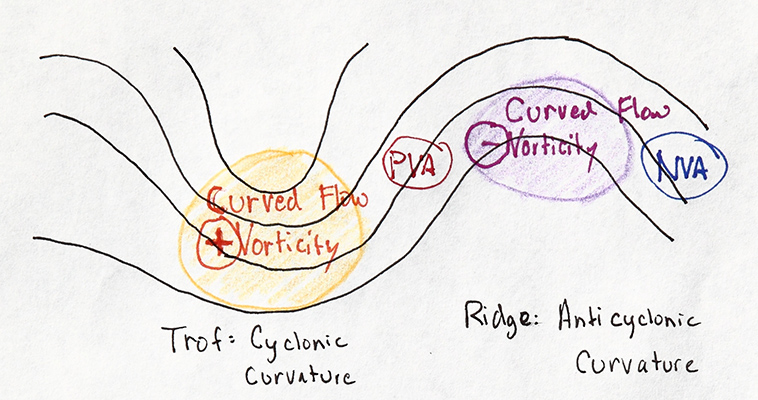
We also can observe that on large scales, a trough, having generally cyclonic flow, will be an area of positive vorticity. A ridge, having generally anti-cyclonic flow, will be an area of negative vorticity. This is an idealized view, and the actual vorticity patterns will depend on the wind flow and have important smaller-scale features.
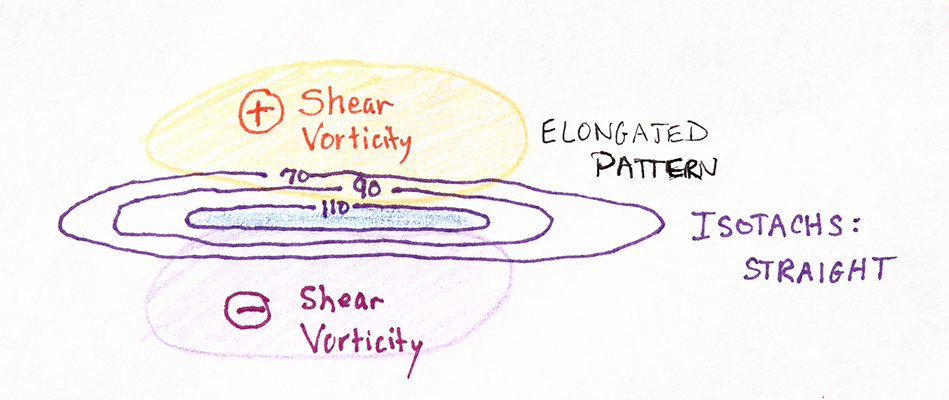
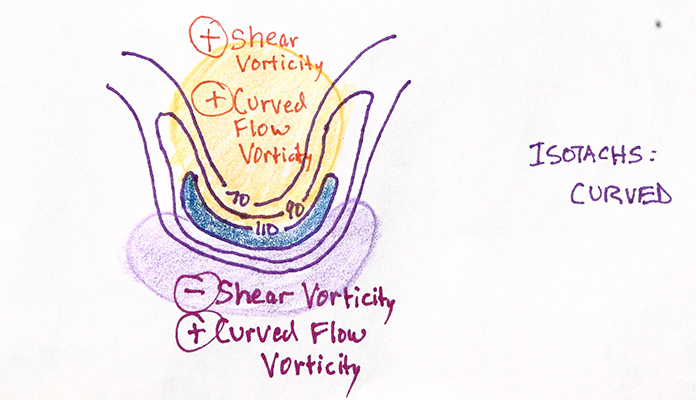
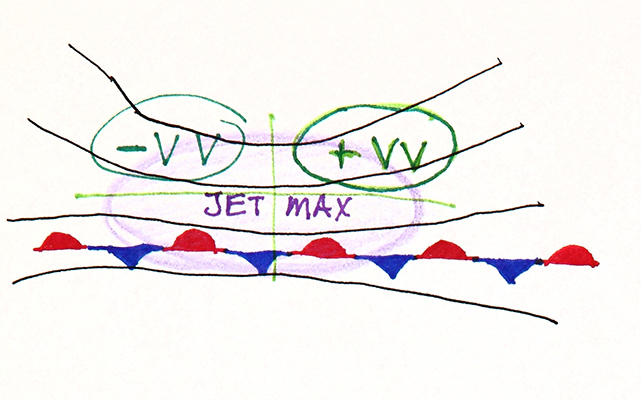
We will look more closely at the wind flow as it relates to vorticity. In the case of a fairly straight jet maximum, the vorticity to the north of the maximum will be positive, due to the wind shear. To the south of the jet max, the relative vorticity will be negative. This is diagramed below.
If the jet maximum is curved, there is the combined effect of the shear vorticity, and the vorticity due to the curvature of the flow.
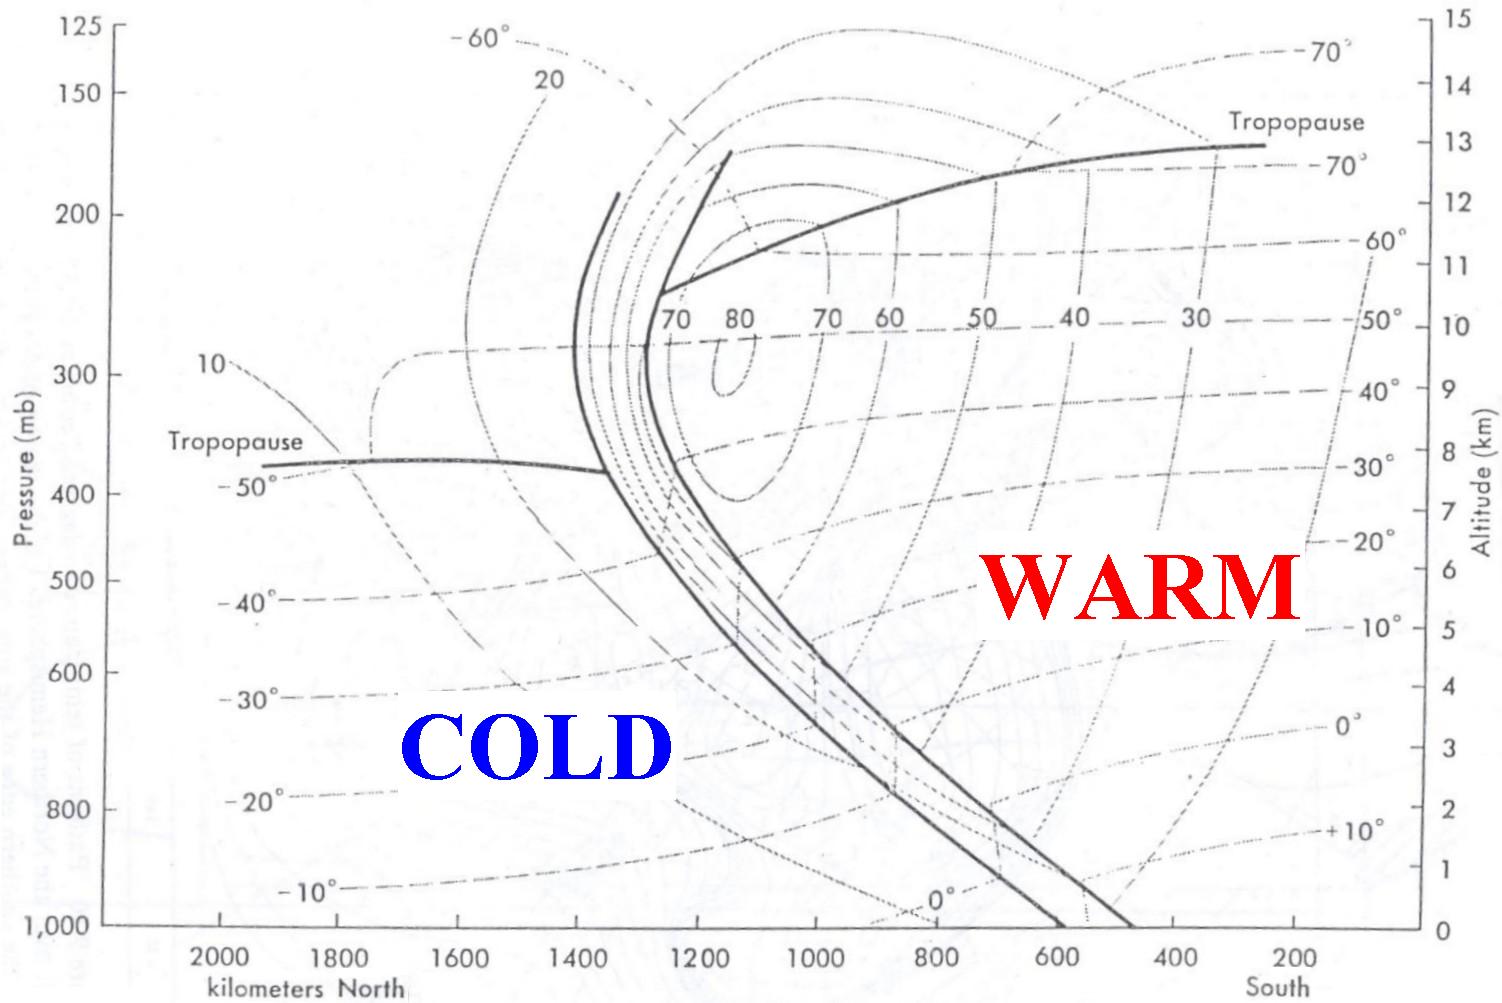
There is a relationship between the jet core and the polar front -- both aloft and at the surface. The cross section below shows the idealized connection between the jet and the polar front.
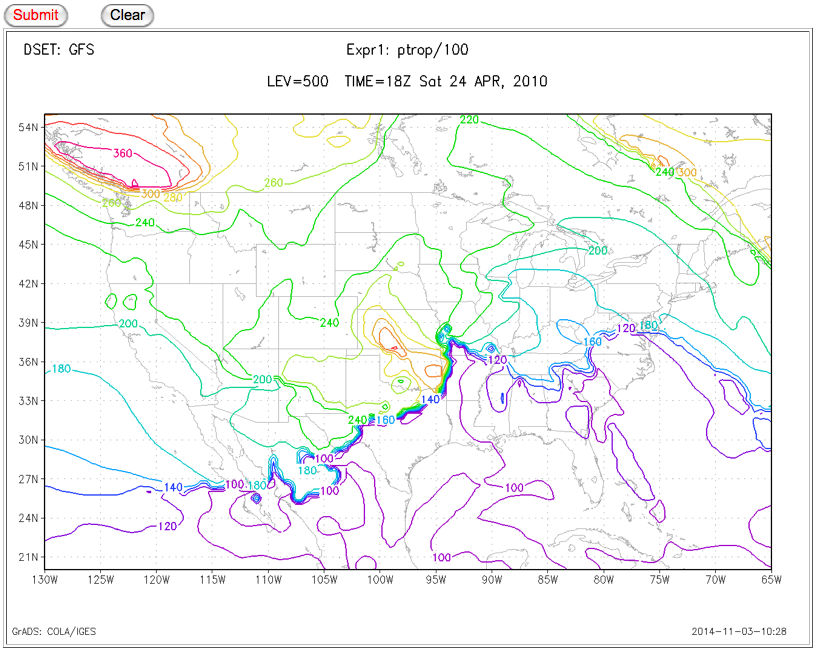
An example of this is shown below. First, the model analysis of the pressure height of the tropopause level. Note the locations where there is a discontinuity -- an abrupt shift in values -- in the analysis of the level of the tropopause.
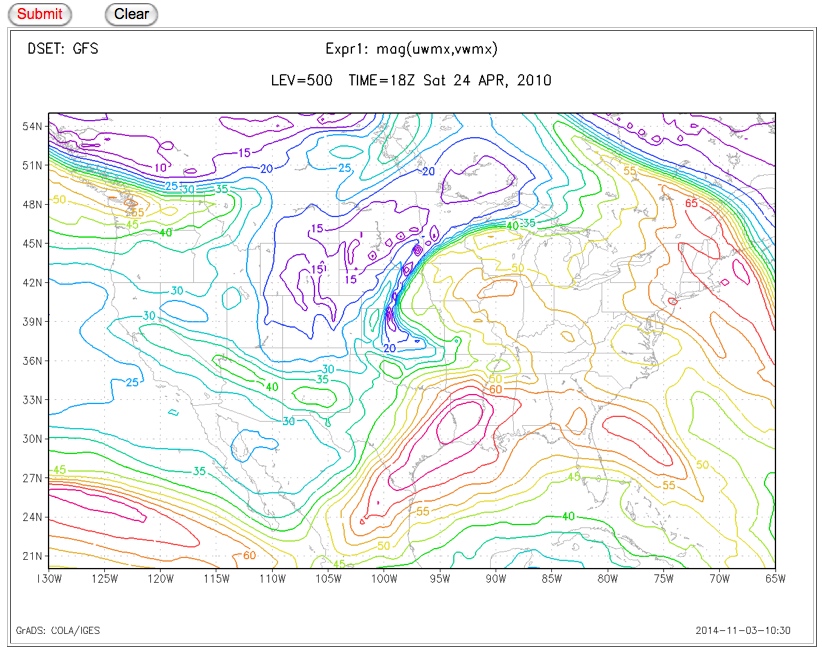
For the same time as above, the isotachs of the winds at the max wind level are shown below.
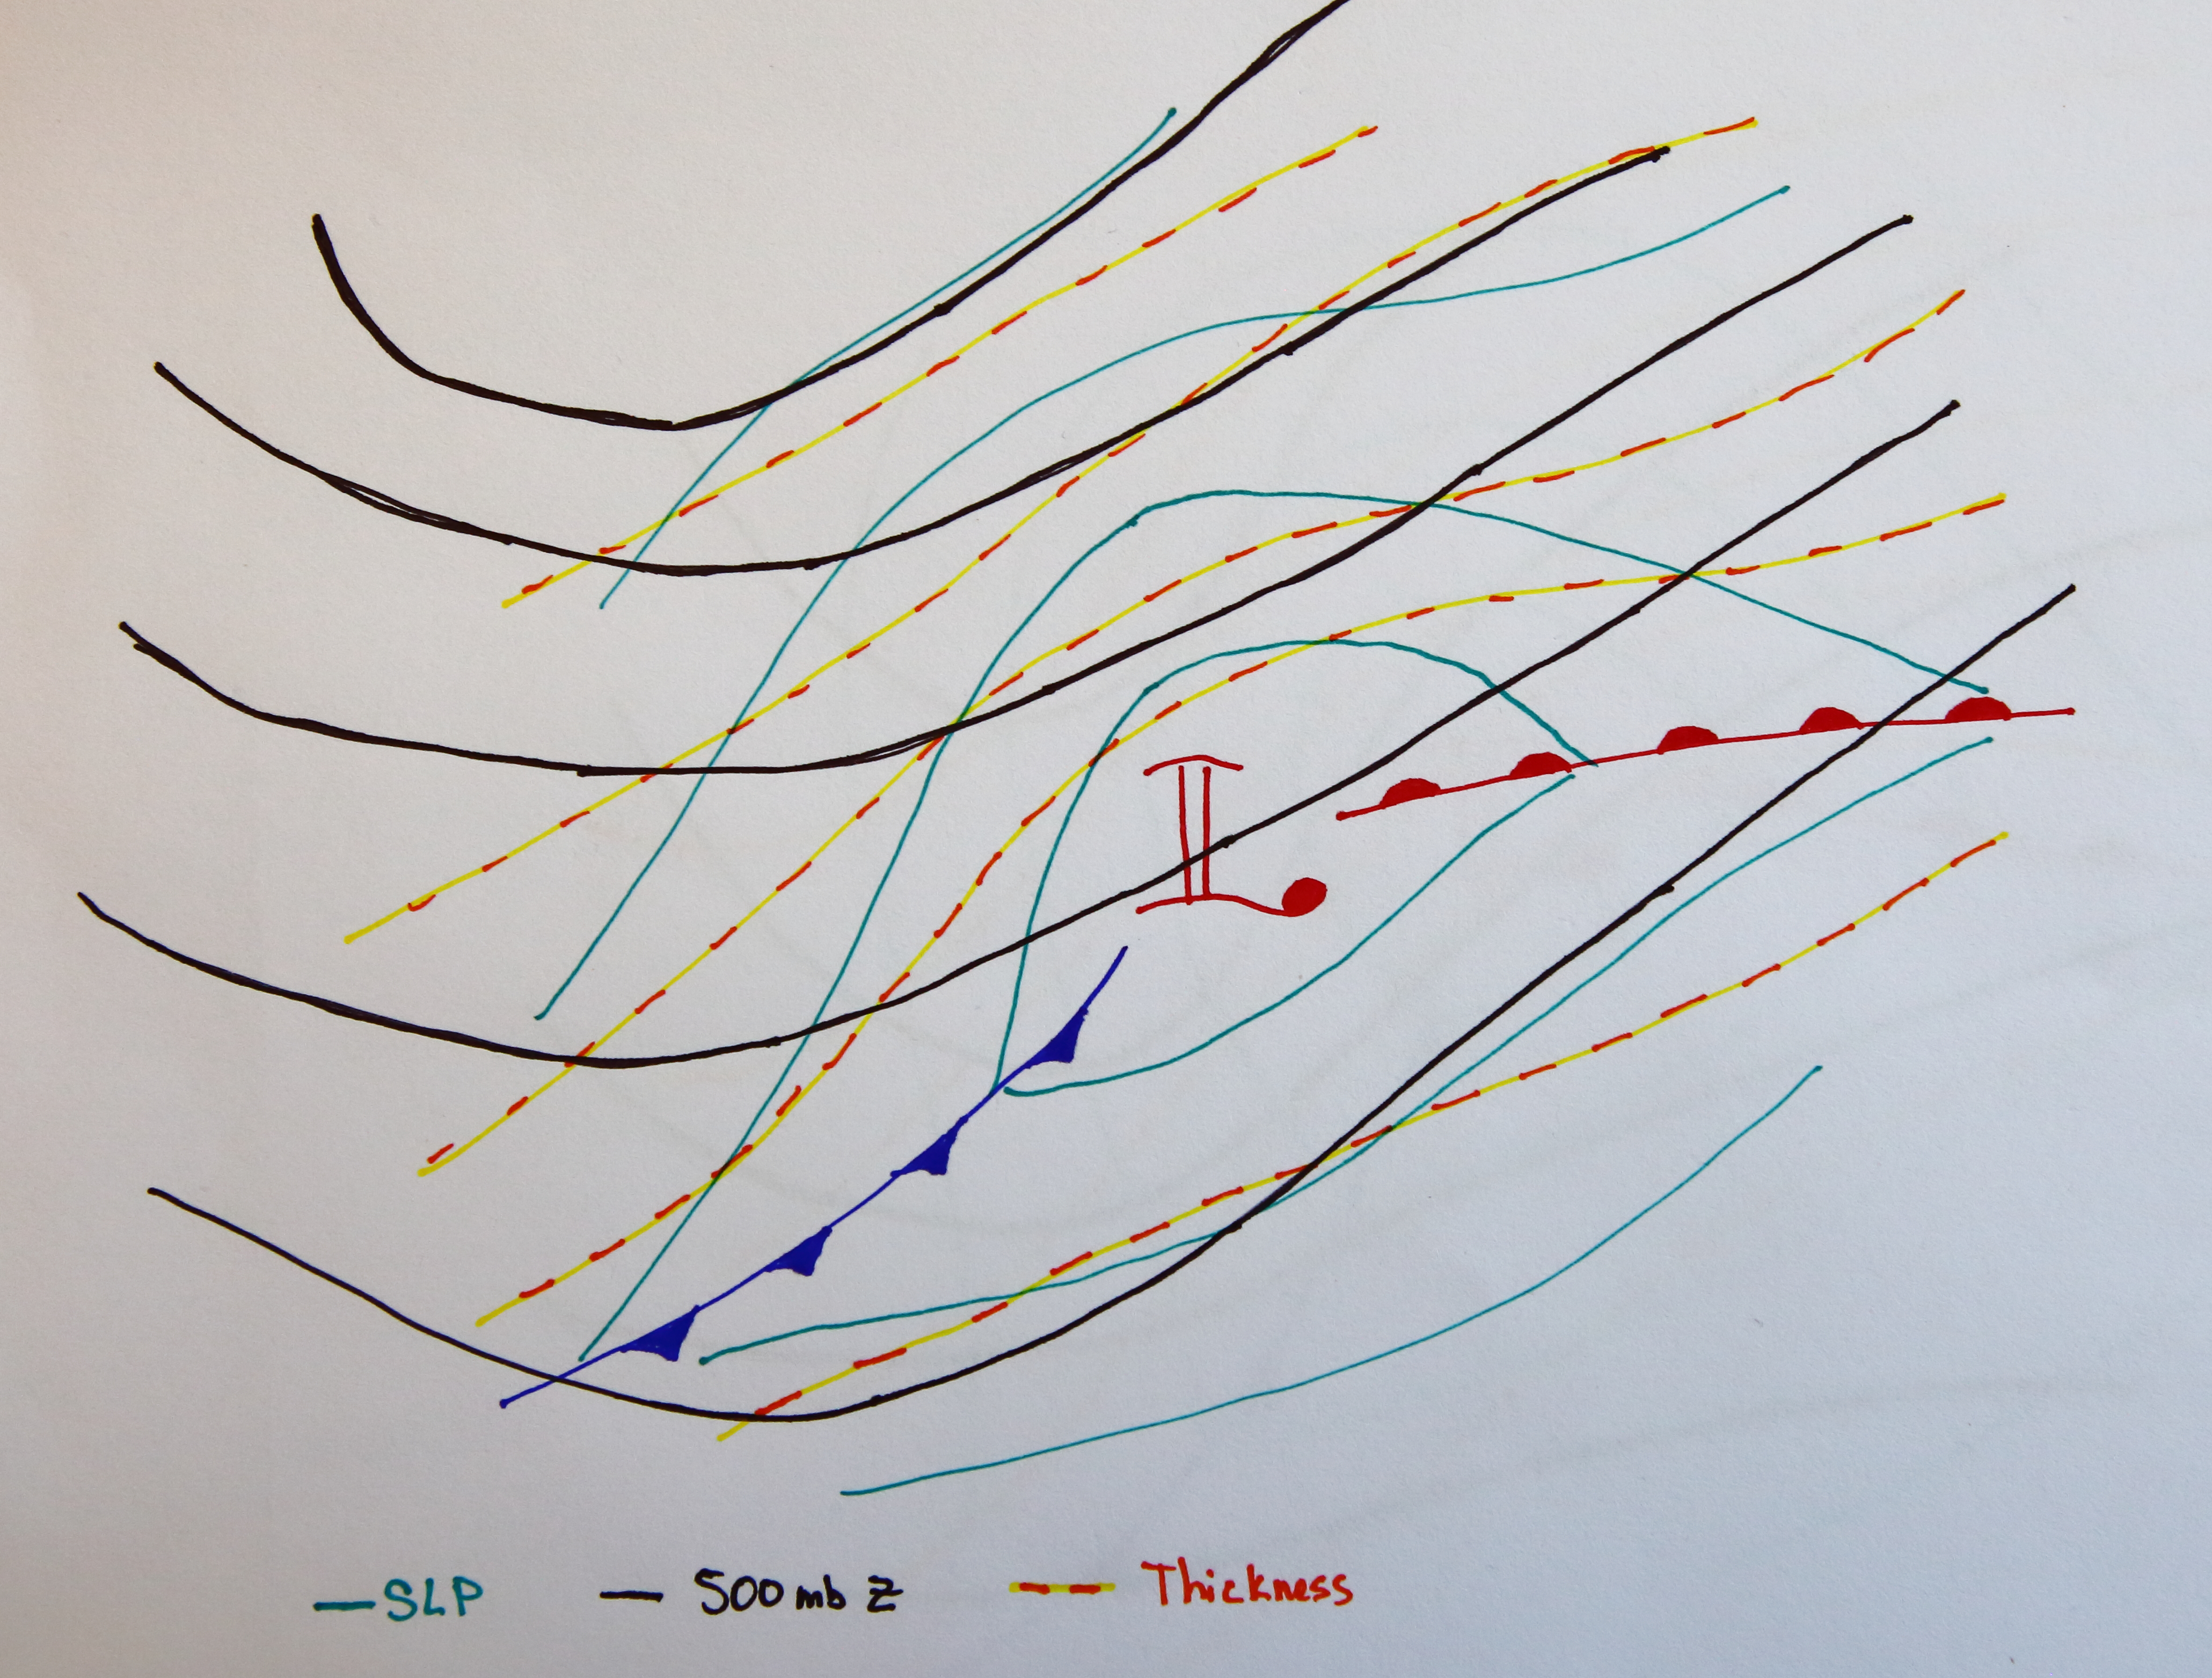
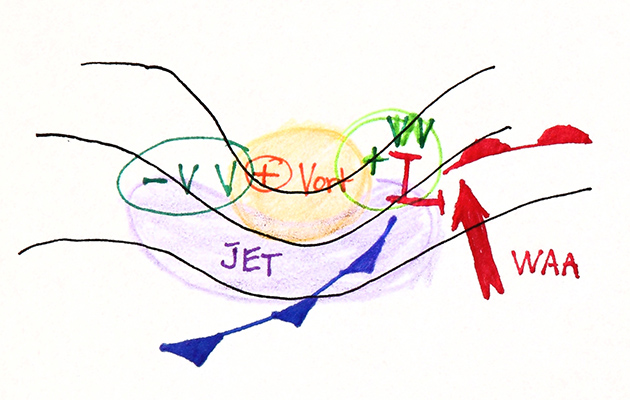
We next look at how a jet maximum might interact with a front near the surface. On the idealized example below, the flow is relatively zonal, and a jet maximum results in positive relative vorticity to the north of the maximum due to the wind shear. This results in positive vorticity advection (PVA) ahead of, and just to the north, of the jet maximum. This also is the left front quadrant of the jet streak, which is a favored region for divergence aloft.
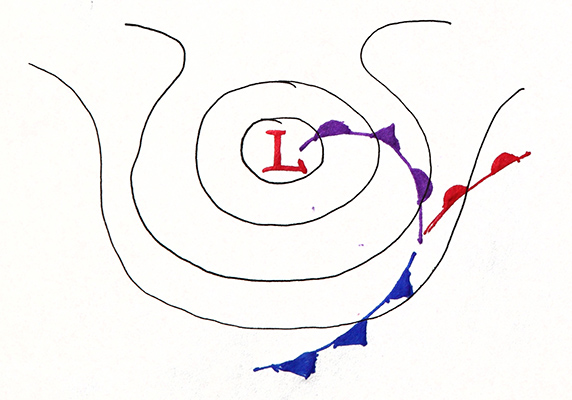
Ascending vertical motion over the front results in a low forming along the front. The near-surface winds flow into the low, resulting in warm air advection ahead of the trough. This strengthens the low, and also deepens the trough. A system where temperature advection is an important factor is called a baroclinic system.
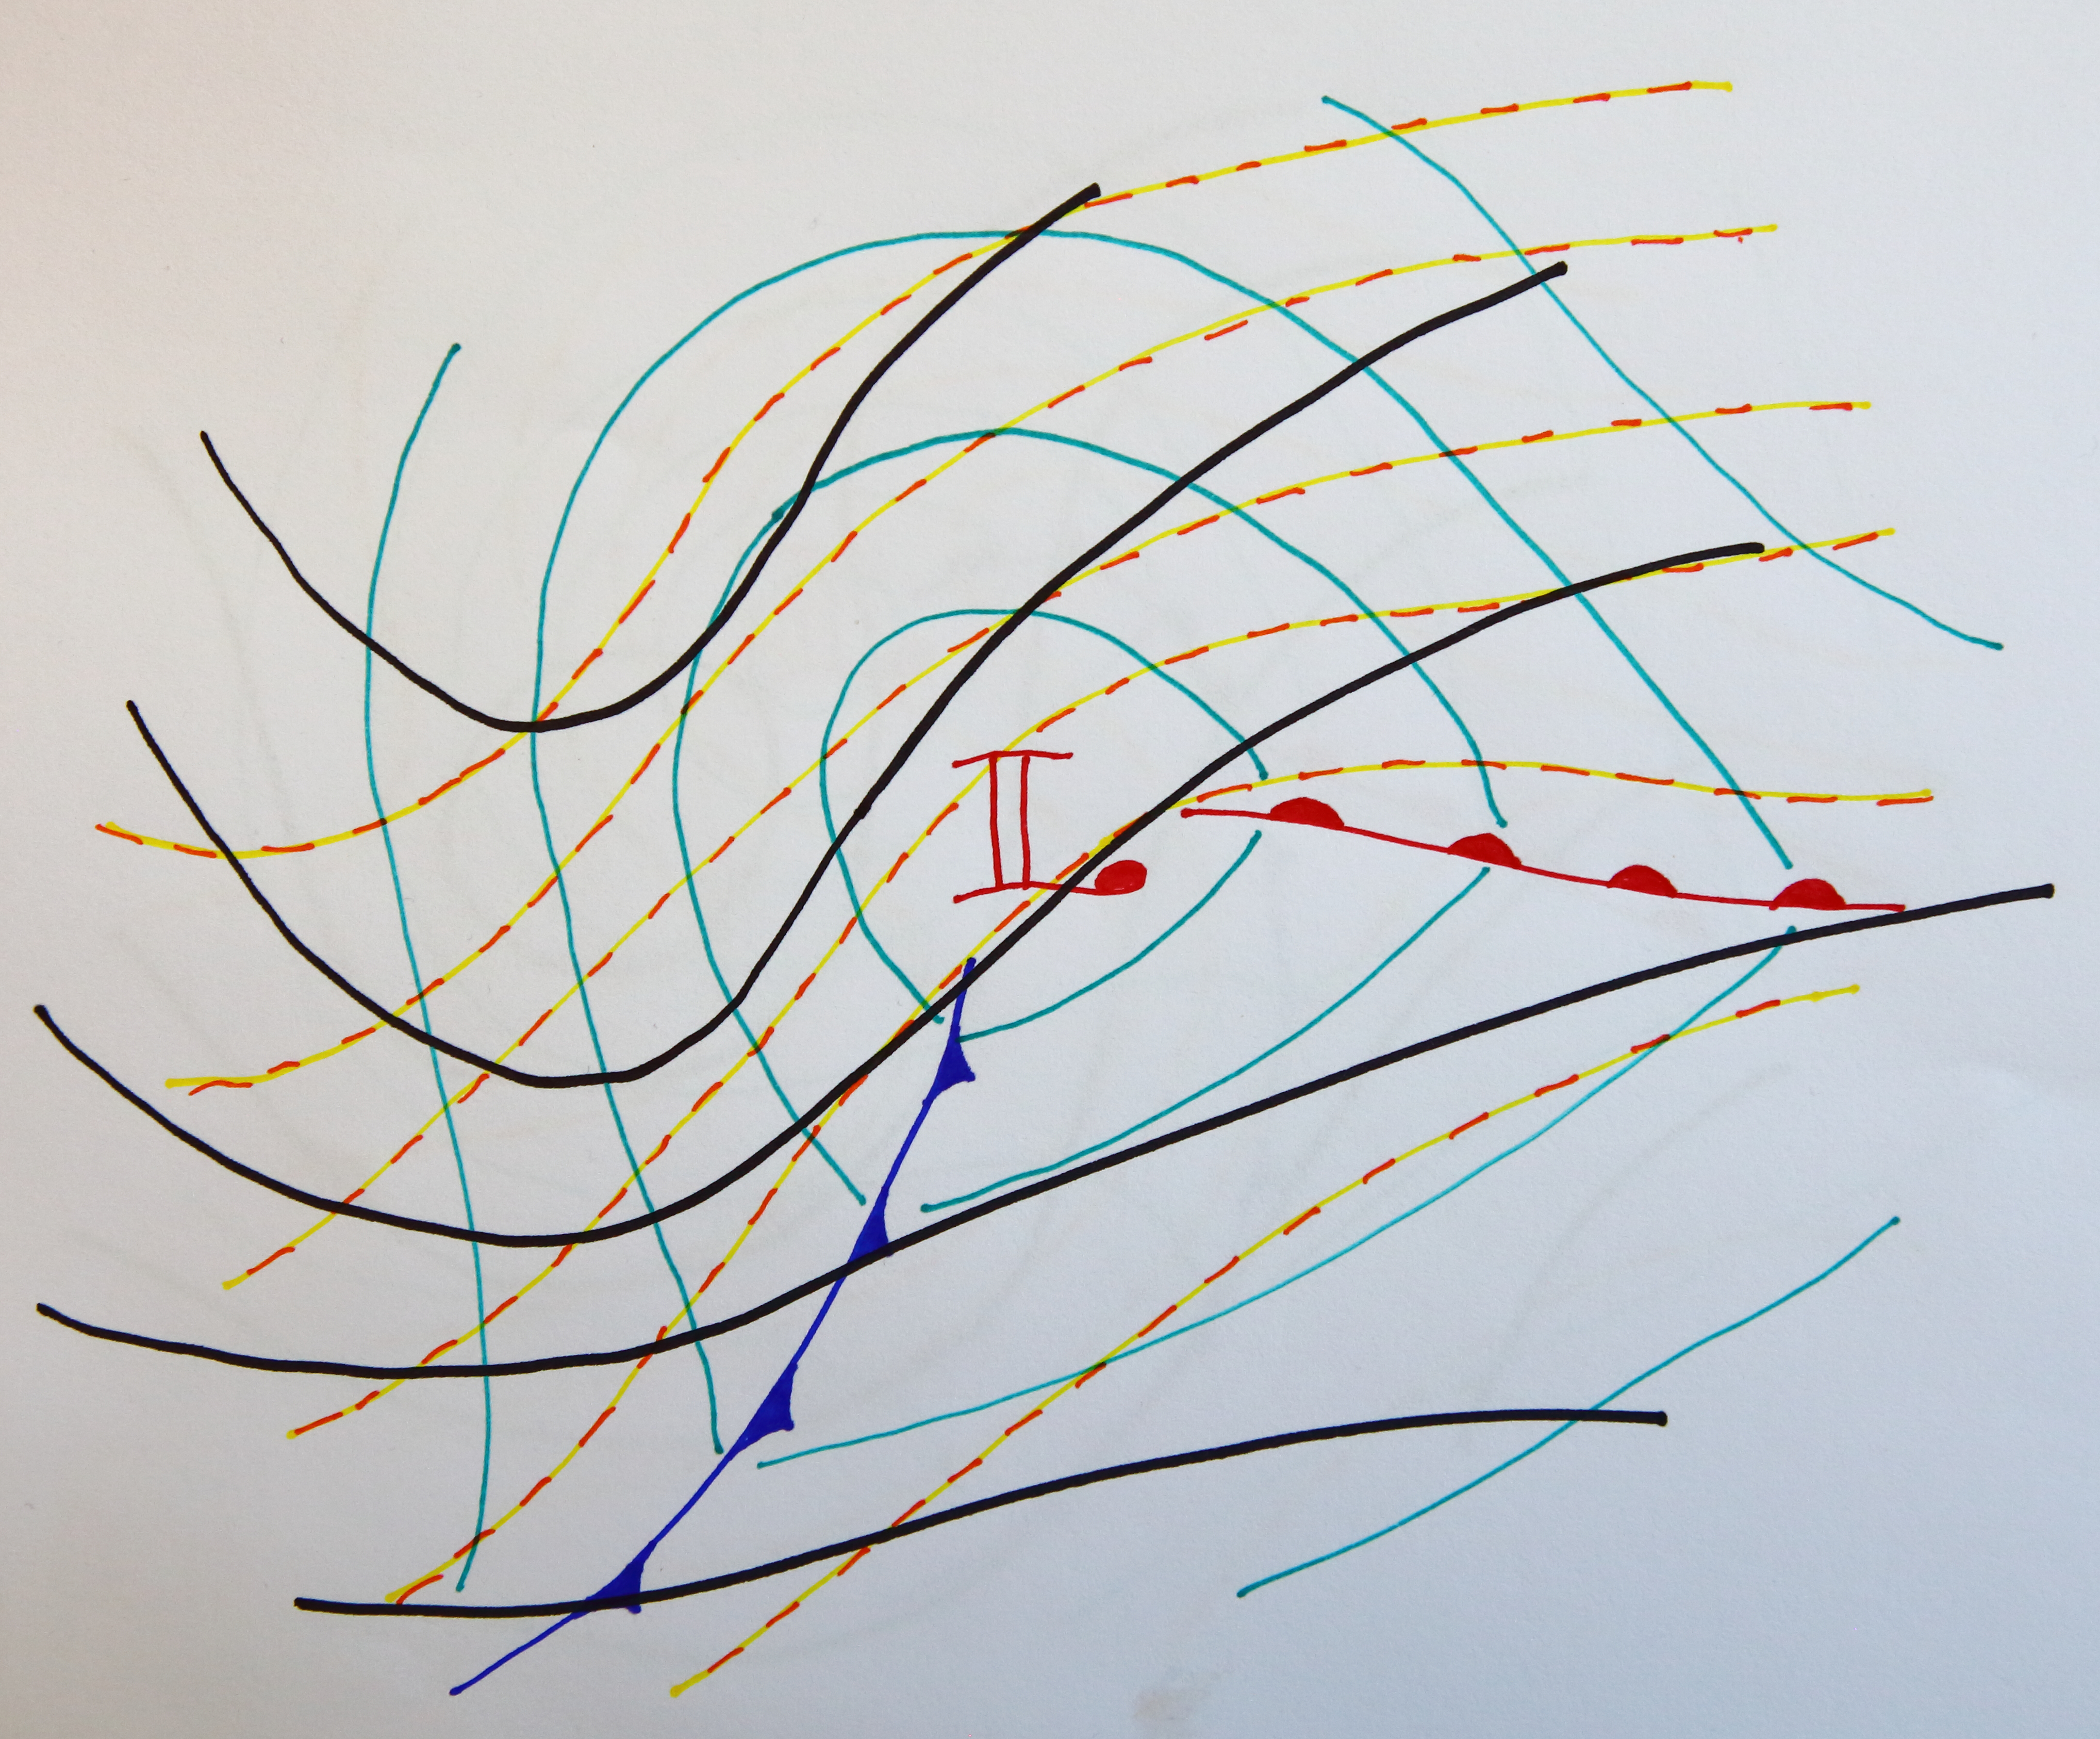
In later stages, the surface low migrates to a location under the upper low, and becomes removed from the frontal zone. At this stage the low becomes a cold-core baratropic low. The isotherms become parallel to the wind flow, and temperature advection becomes minimal.
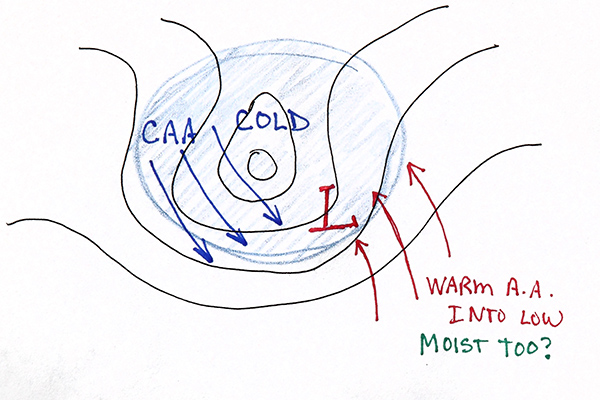
Consider the mature stage of a baroclinic system, when the surface low is strengthening most rapidly The near-surface warm air advection ahead of the low is well developed, as is the cold air advection behind the low.
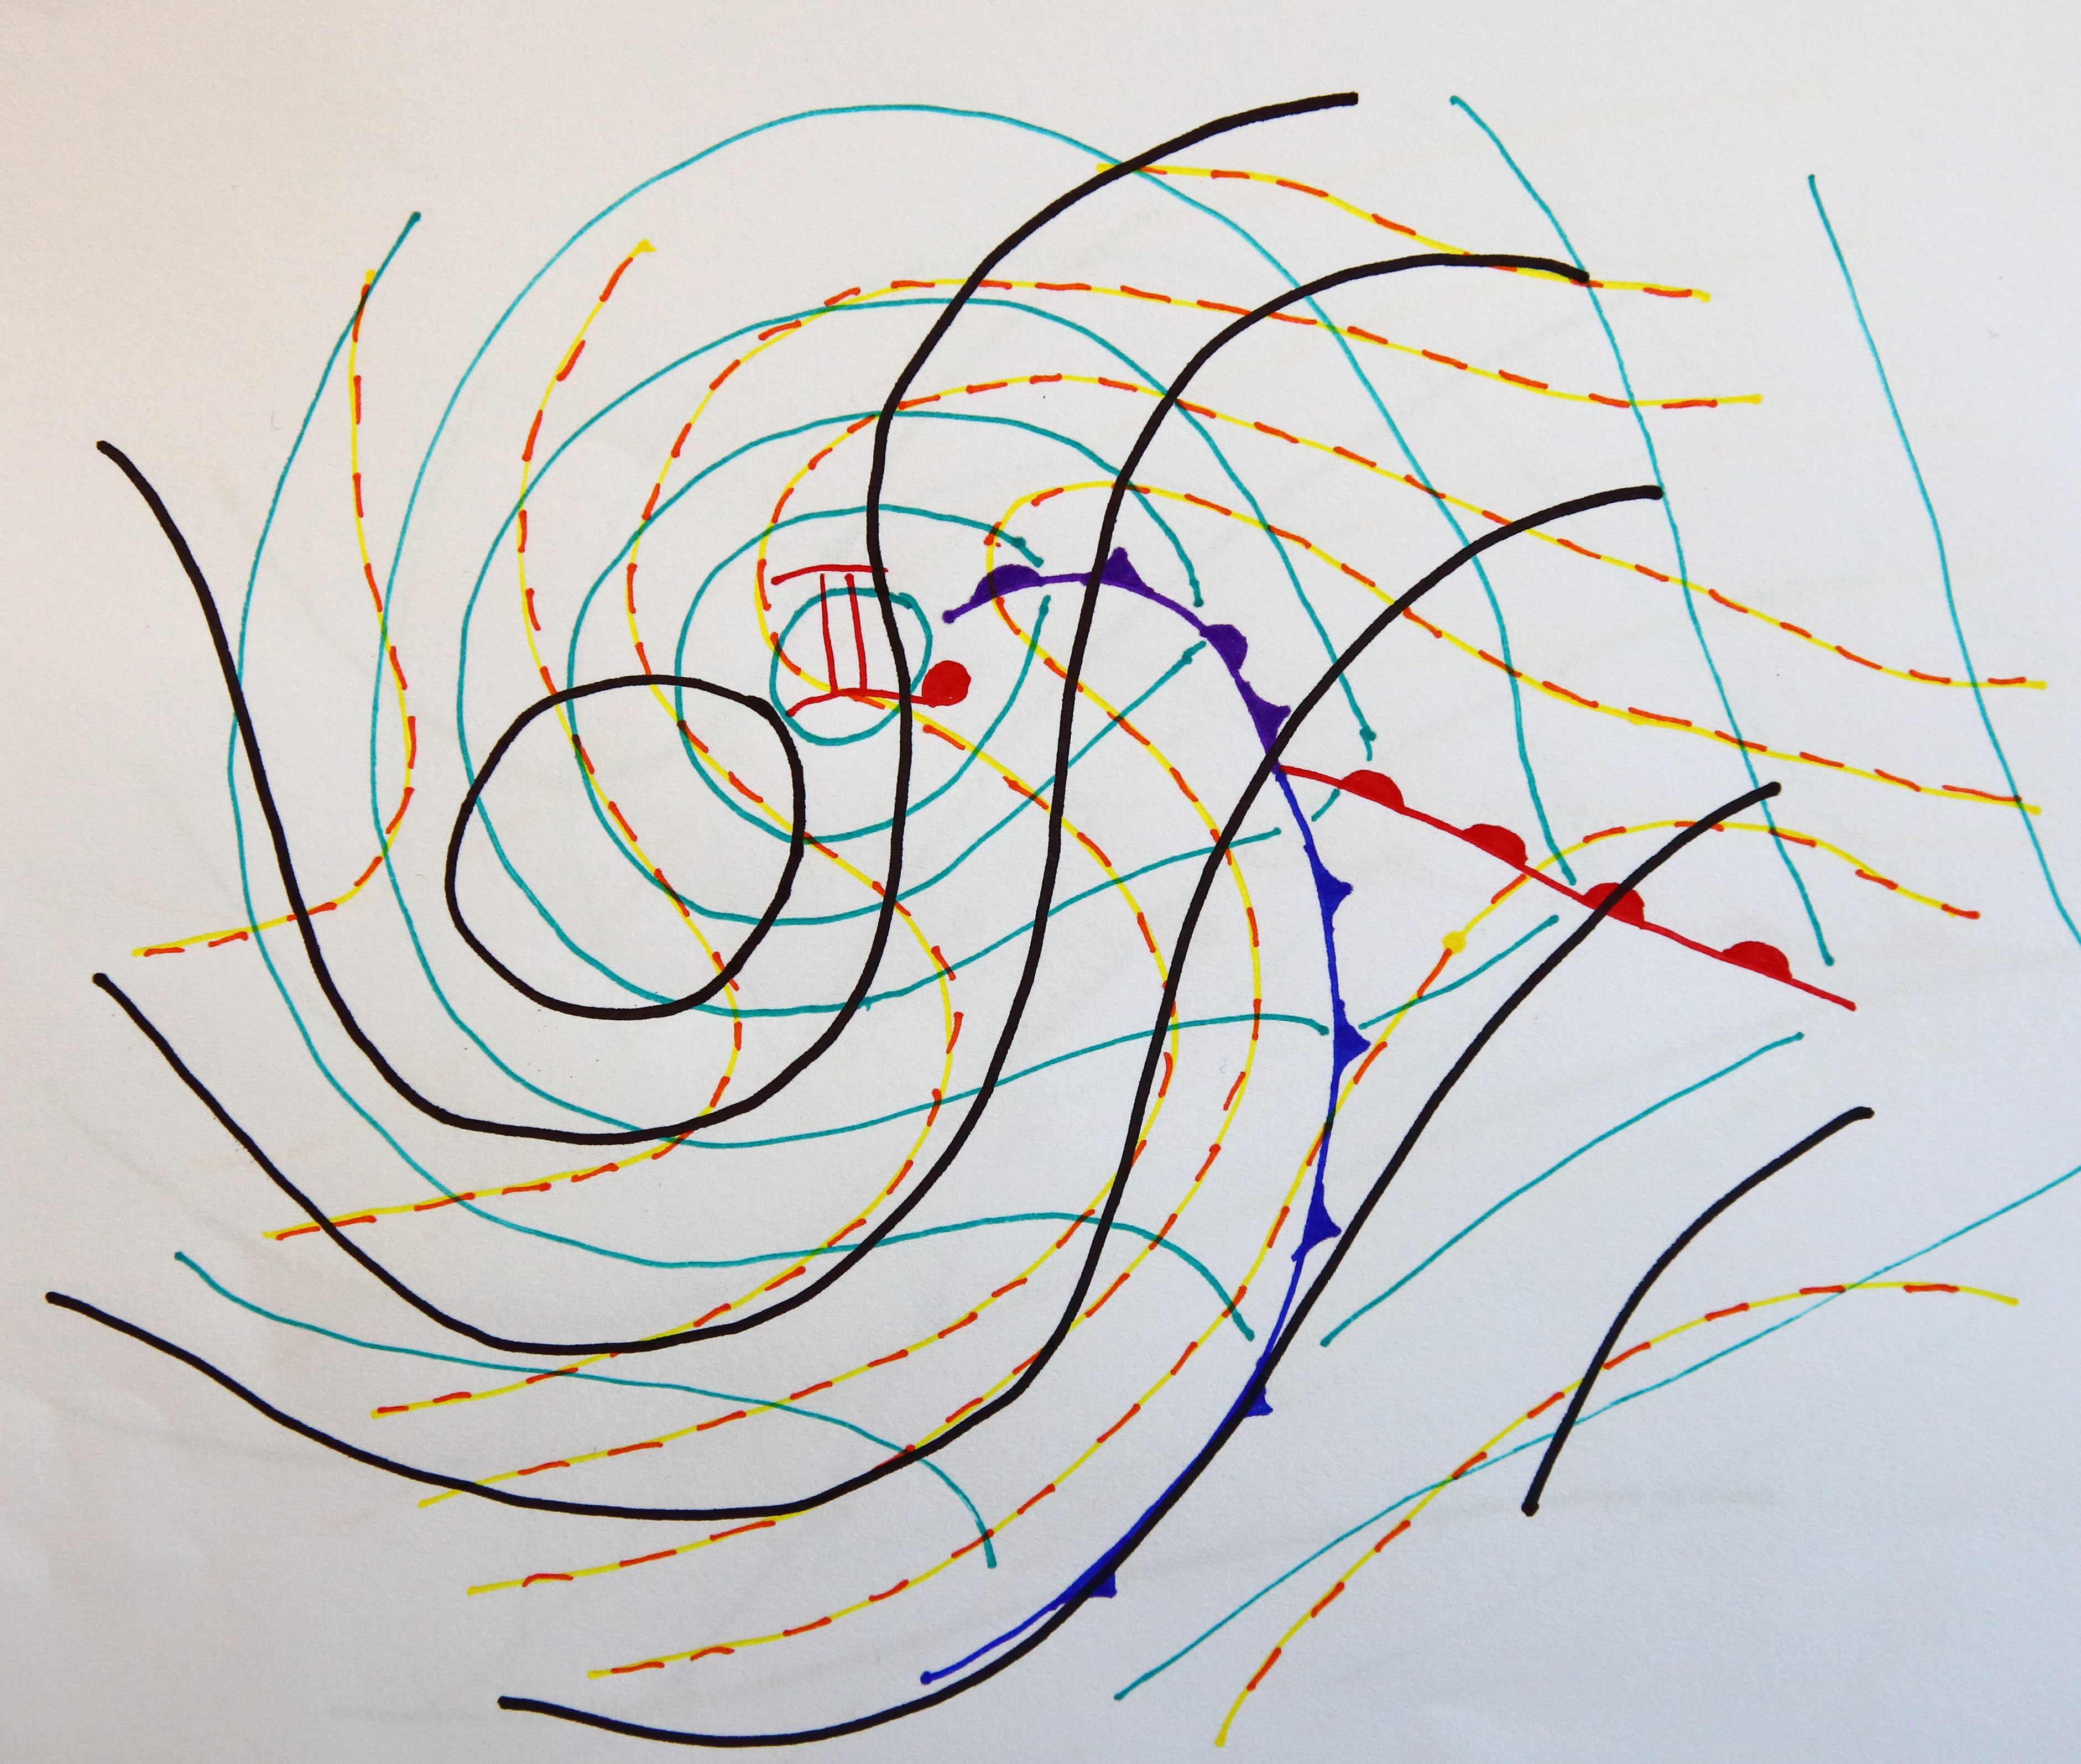
While, in general, the trough is an area of cold mean temperature below 500mb, this is not the case near a strong mature low. Warm air advection near the surface, bringing in warm air below the trough, will result in an unstable vertical profile, due to the colder air aloft associated with the upper trough. This provides a generally unstable environment, supportive of upward vertical motion, and perhaps convection.
The same consideration applies to the air behind the trough, where cold air near the surface and somewhat less cold air aloft gives a stable vertical profile. There will also be subsidence behind the low, often forming a baroclinic high. In some cases, the high will have formed in a source region as a baratropic high, and has been dislodged by the circulation around the low, becoming a baroclinic high.
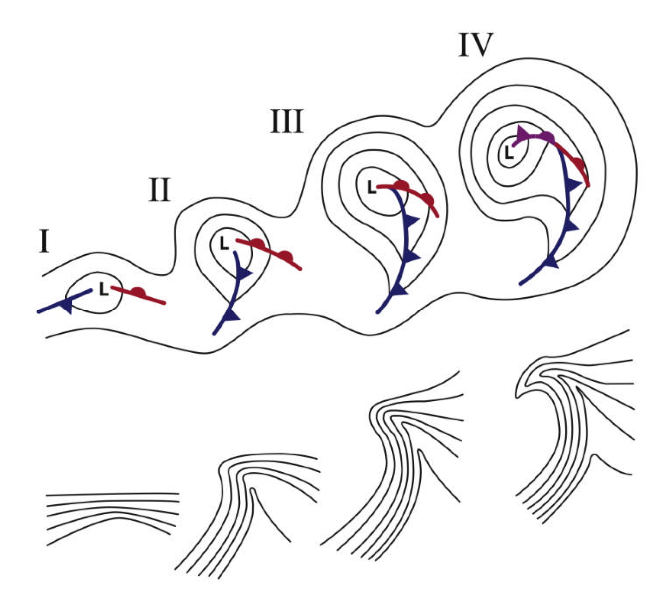
The "Norwegian Model" for cyclone development shows the typical life-cycle of a mid-latutide cyclone: