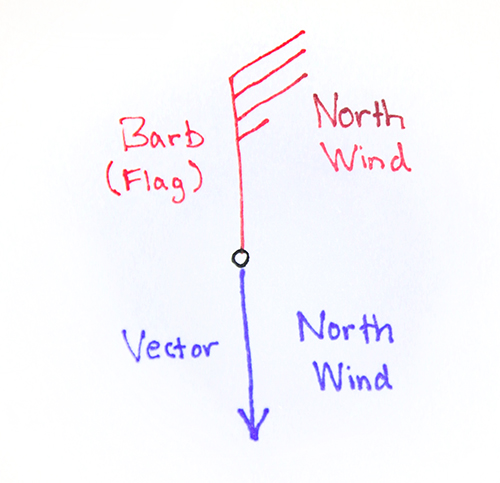
Air flow in the atmosphere has both a speed and direction. This is represented mathematically by a vector. Maps that show winds will also sometimes display them as vectors. Remember that wind barbs point in the direction the wind is coming from. Wind arrows (vectors) point in the direction the wind is blowing towards.
Also remember that by convention, we speak of winds in terms of the direction they are coming from. So if I say "a south wind", that is a wind coming from the south. The wind barb would be pointed south, and the wind arrow would be pointed north.
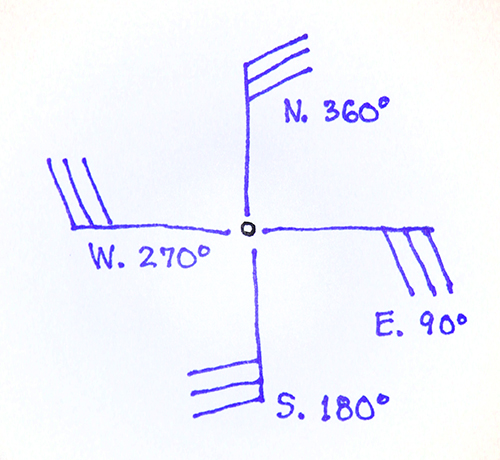
The way winds are reported in the raw observations (eg. Metars) is for a south wind to be 180°, an east wind to be 90°, etc. See the graphic below:
Unfortunately, once we start thinking of wind as a mathematical vector, we want to use the mathematical convention for the direction:
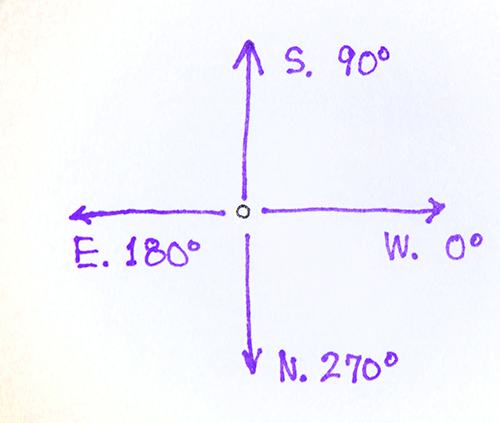
To convert from "meteorological direction" to "math direction", use use this formula (in degrees):
md = 270 − wwd where md is the "math" wind direction, and wwd is the "weather wind direction". If the value is less than zero, just add 360. Note that using our math wind direction, a due west wind will have a vector pointing along the x-axis and thus a direction of zero degrees.
Fortunately almost all wind data we might work with has already been converted to "math" wind direction. And we will always assume the "math" wind direction when we are working with the equations.
It is common practice in meteorology to work with the u and v components of the wind.
Remember that a vector can be broken into component vectors, where the i unit vector runs parallel to the x asis, and the j vector runs parallel to the y axis.
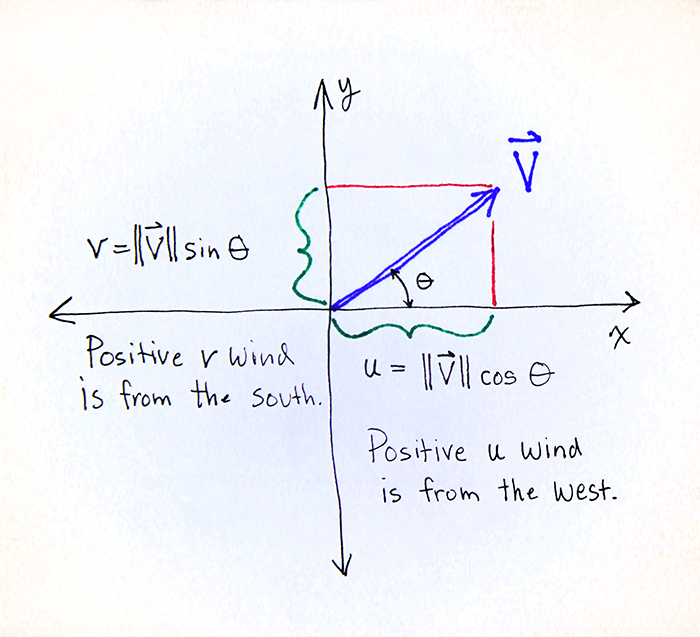
For winds, the u wind is parallel to the x axis. A positive u wind is from the west. A negative u wind is from the east. The v wind runs parallel to the y axis. A positive v wind is from the south, and a negative v wind is from the north.
If we have the wind speed and wind direction, we can obtain the component vector winds, u and v, as follows:
u = ws * cos(θ)
v = ws * sin(θ)
When using sin and cos on a calculator or computer, take care to convert from degrees to radians, if necessary.
The wind data from the numerical models and the objective analysis systems is always reported as the magnitude of the component vectors u and v. So they are provided as scalar fields. Software packages for looking at weather data will have ways to combine the u and v wind component data for display of wind arrows, wind barbs, and streamlines.
Given the u and v components, how do we determine the direction and magnitude of the wind vector? To get the magnitude (or wind speed) we use the Pythagorean Theorem:
ws = sqrt(u2+v2) Stated in words, this is the square root of the sum of the squares.
To get the direction, we turn again to trigonometry. We have x and y (u and v), and we want an angle. This will require the inverse trig function of tan -- eg, arctan(v/u).
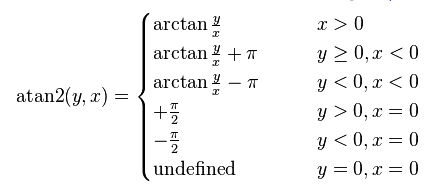
However, it is more complex than this. When u is zero, we are unable to use the arctan function. In addition, we must adjust for which quadrant we are in, based on the sign of u and v.
On the computer, standard math libraries have the atan2 function, which takes two arguments -- the component vector magnitudes. This function takes care of the issues with arctan. See the Wikipedia entry for atan2 for a description of what it does, especially this table:
If you ever need to convert from u and v to speed and direction, and you get confused about the direction, plotting the u and v winds as vectors on a graph will give you a sense of what the angle of the total wind vector will be. Be sure to plot the positive u vector pointing to the right from the origin, and the negative u vector pointing to the left. The positive v vector points up, and the negative v vector points down.
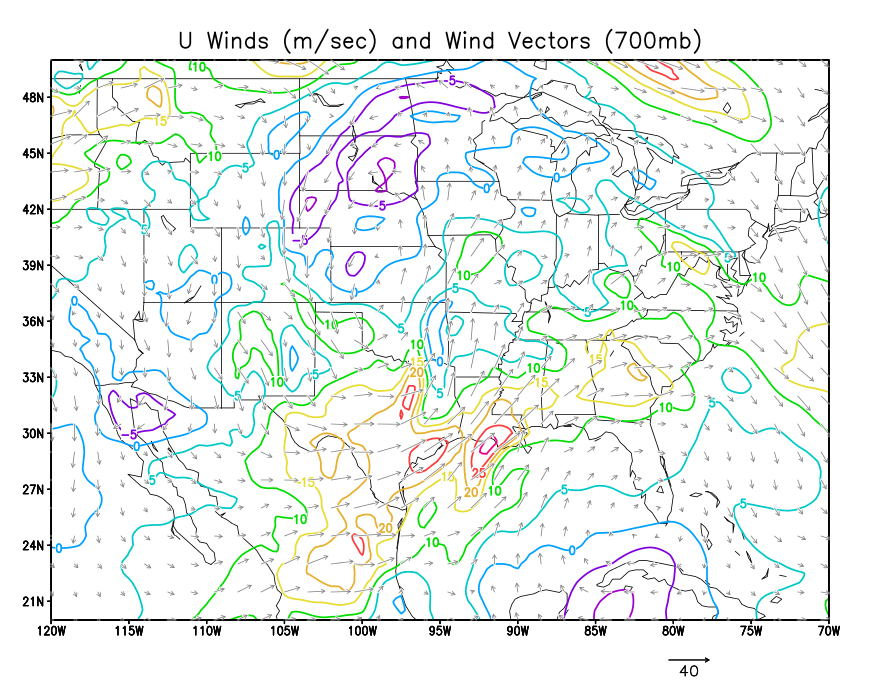
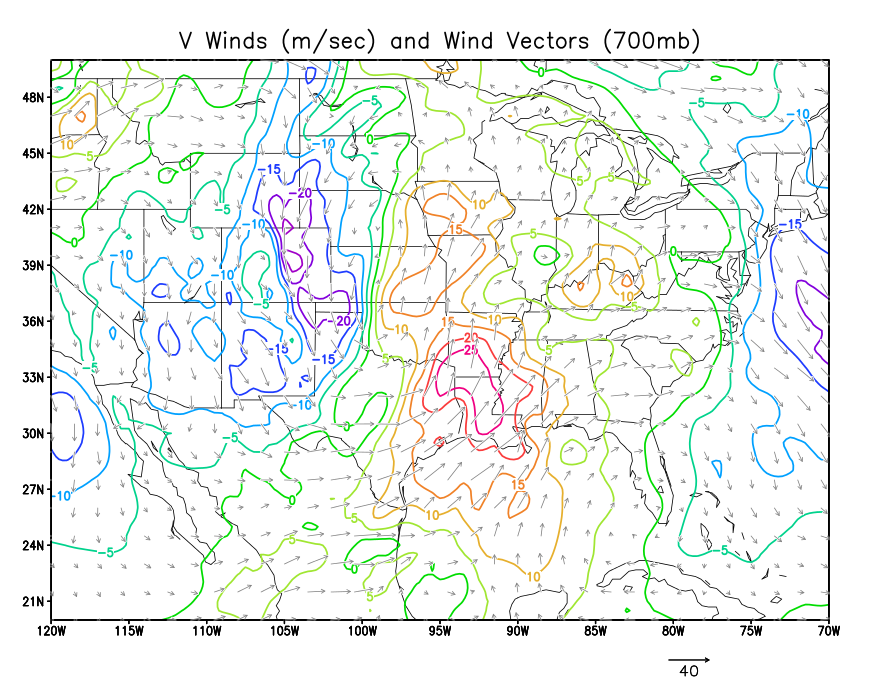
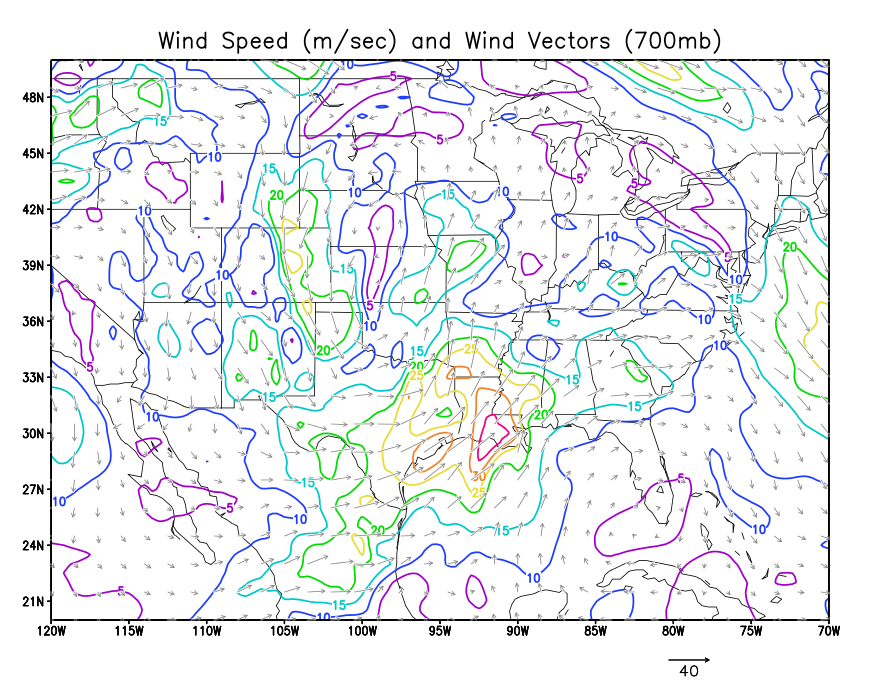
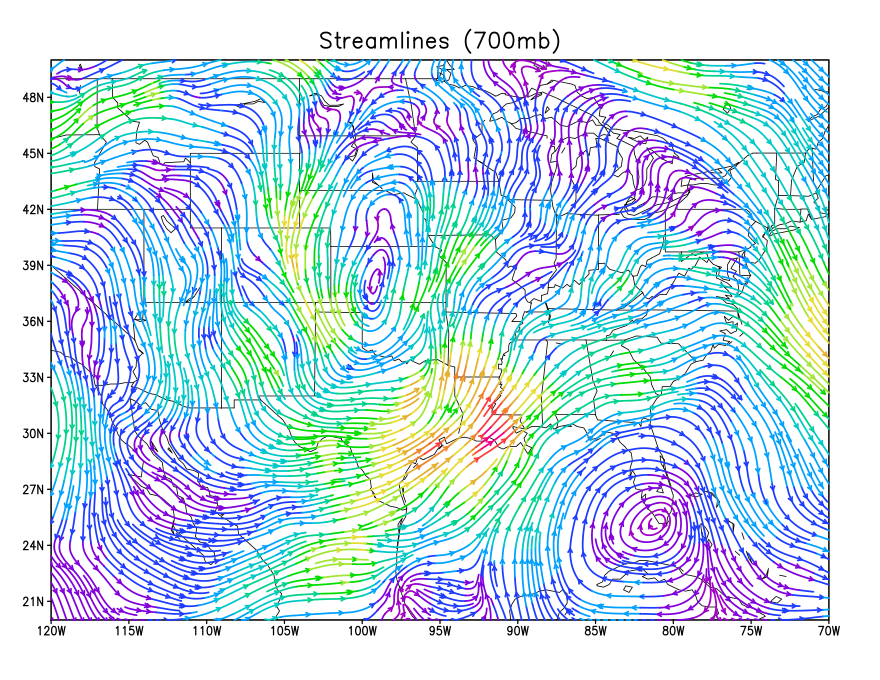
Below are four plots. The first is a plot of the u wind magnitude, plotted as a scalar field using contours. The 2nd is a plot of the v wind field. The third is a plot of the wind speed. The fourth is a plot of the streamlines (lines parellel to the wind flow).
Carefully note how the various values (both positive and negative) of u and v combine to produce speed and direction.