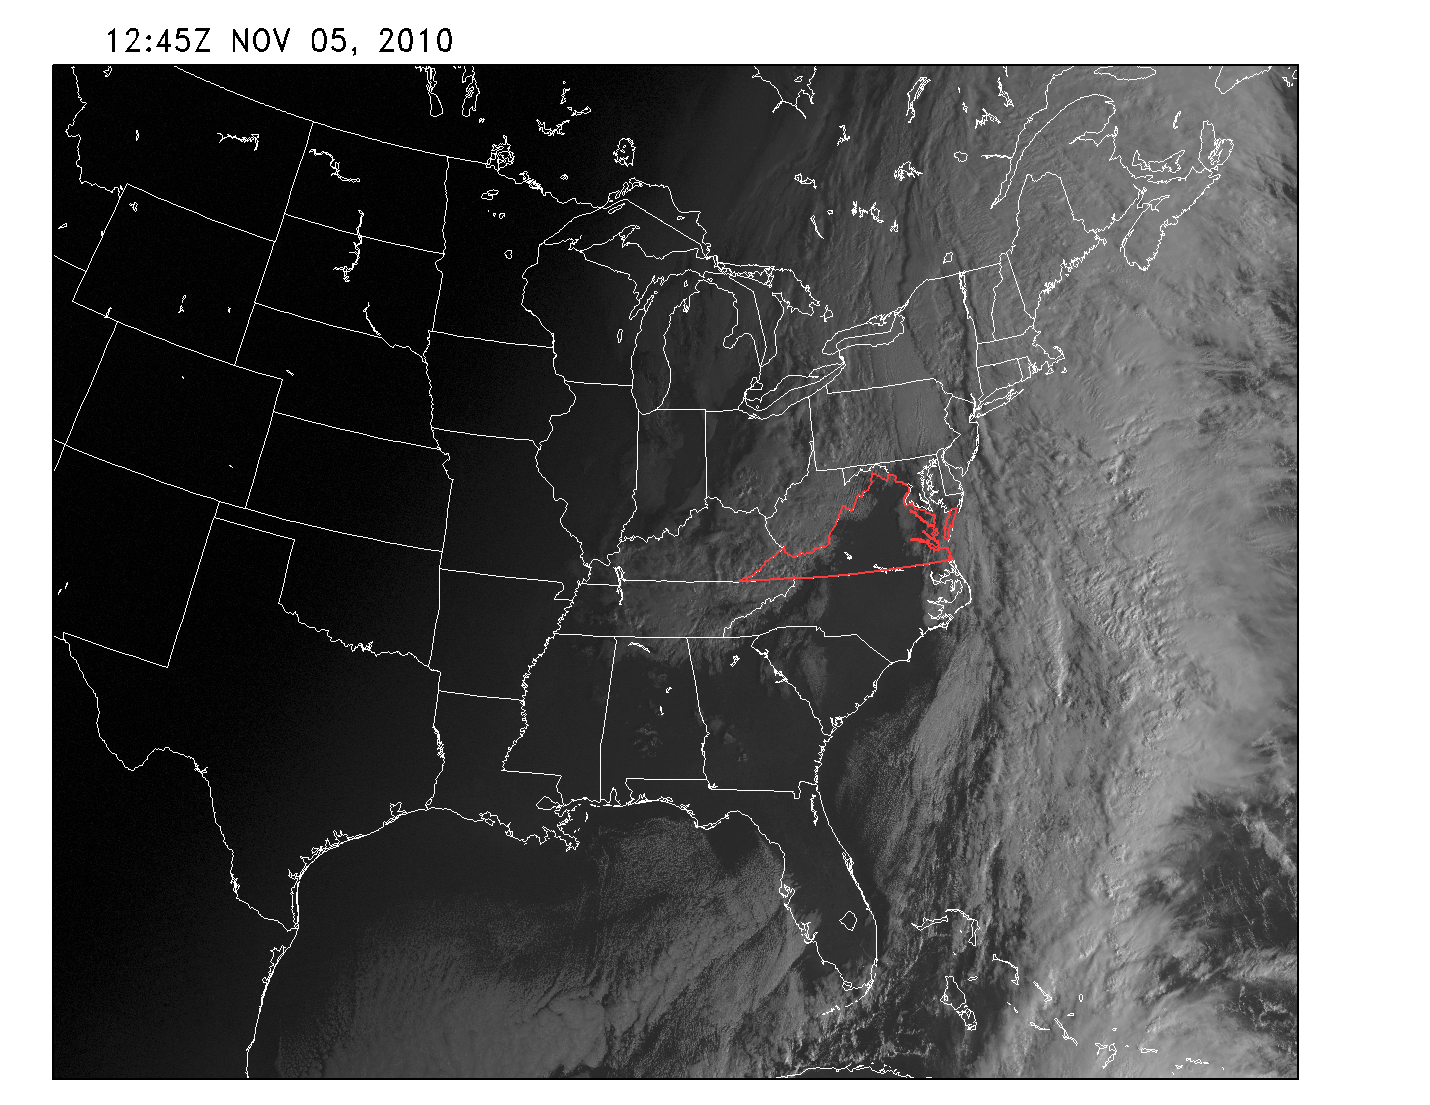
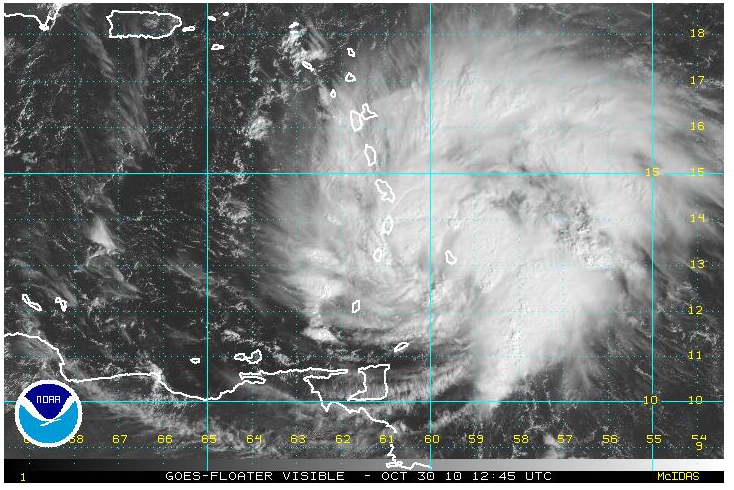
Note on the visible satellite the dry slot currently over the eastern coastal plain. Also note the clear area is between the departing vorticity maxima (ie, NVA) to the east and the upper cold pool to the west.
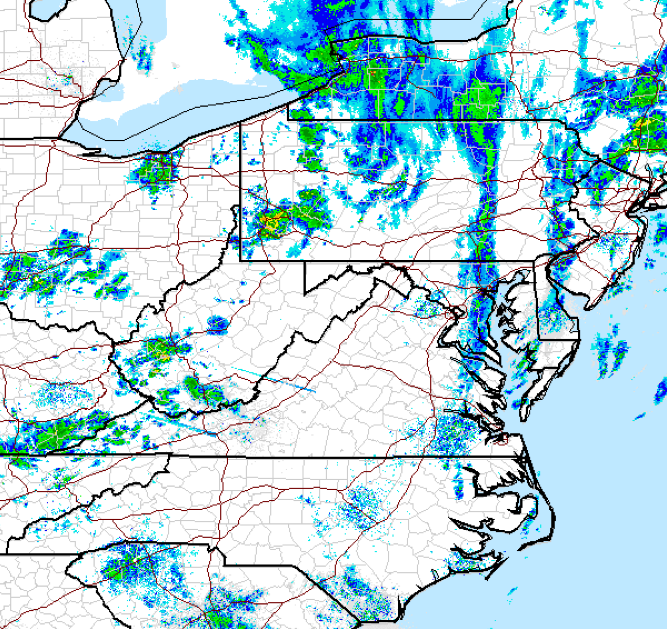
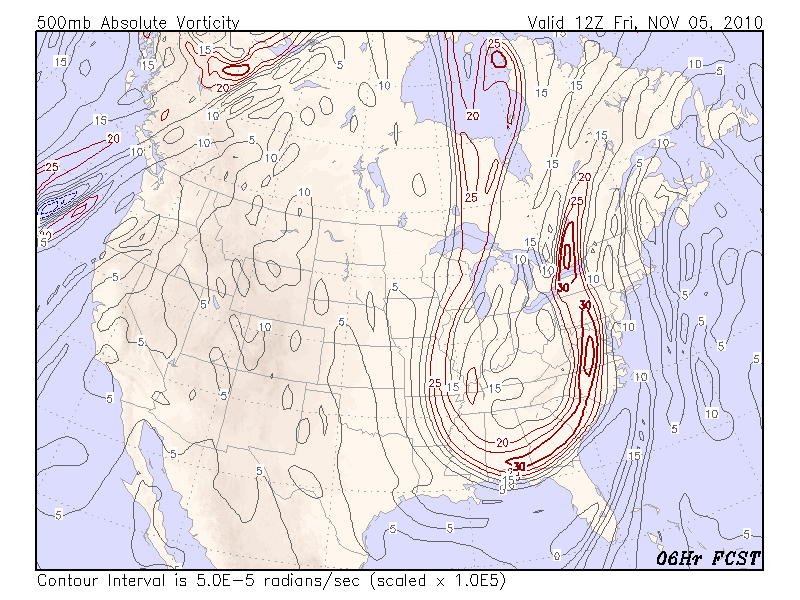
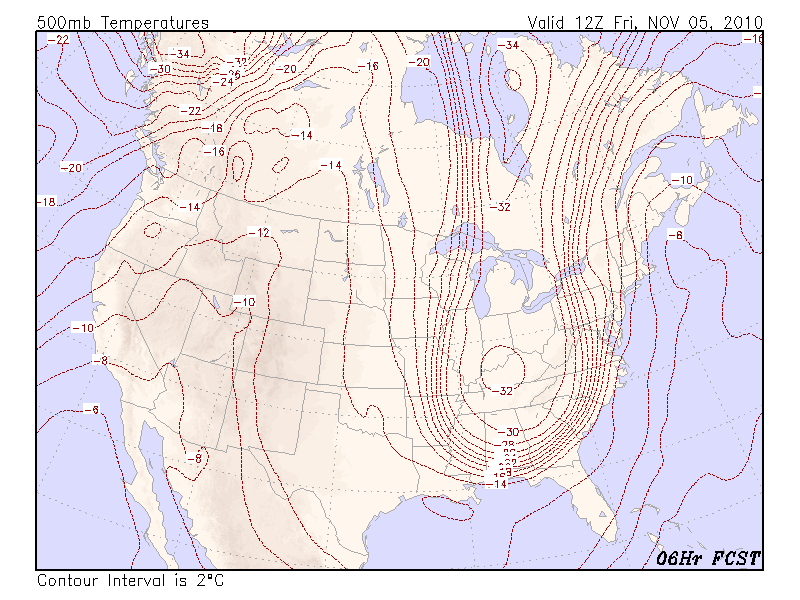
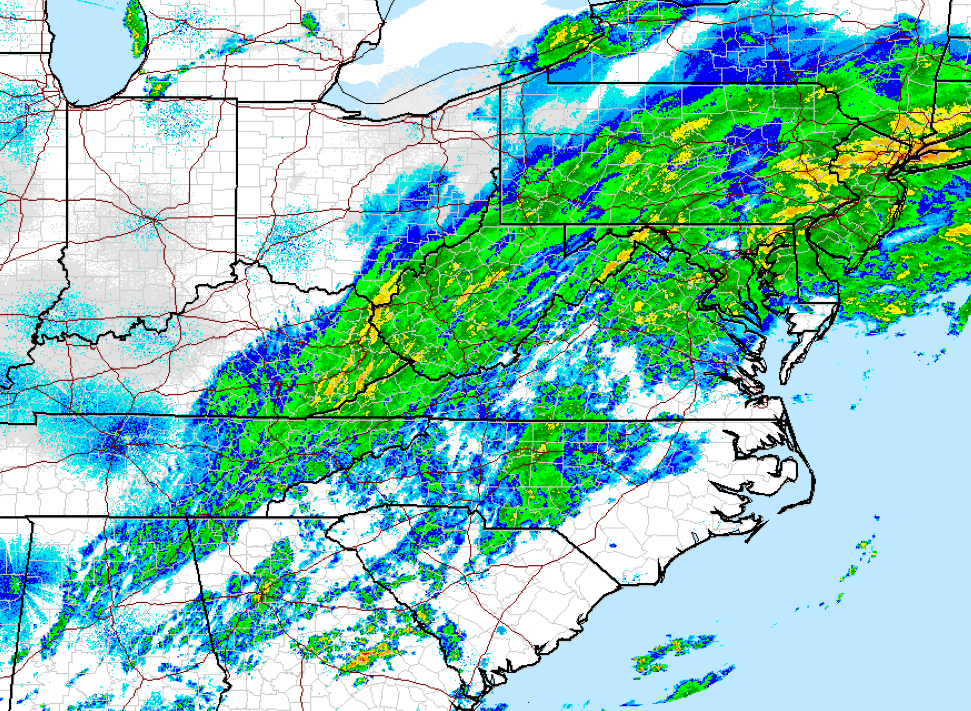
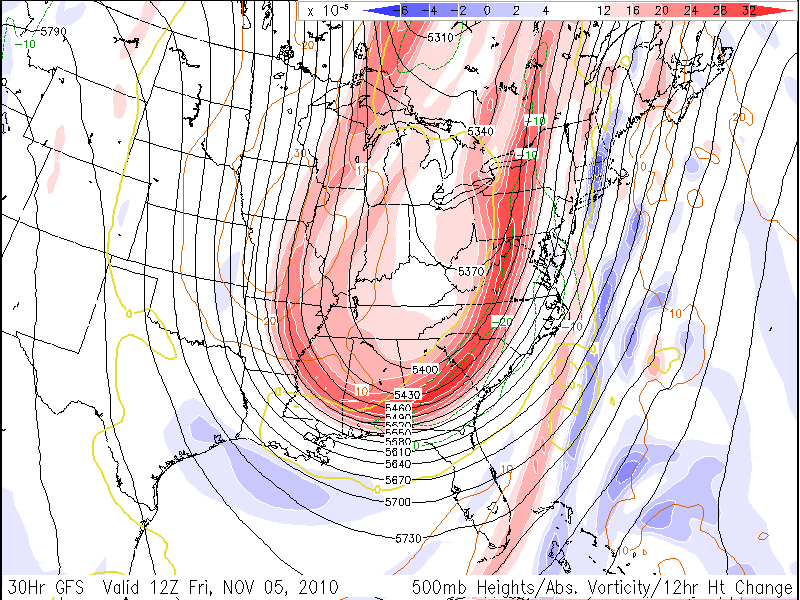
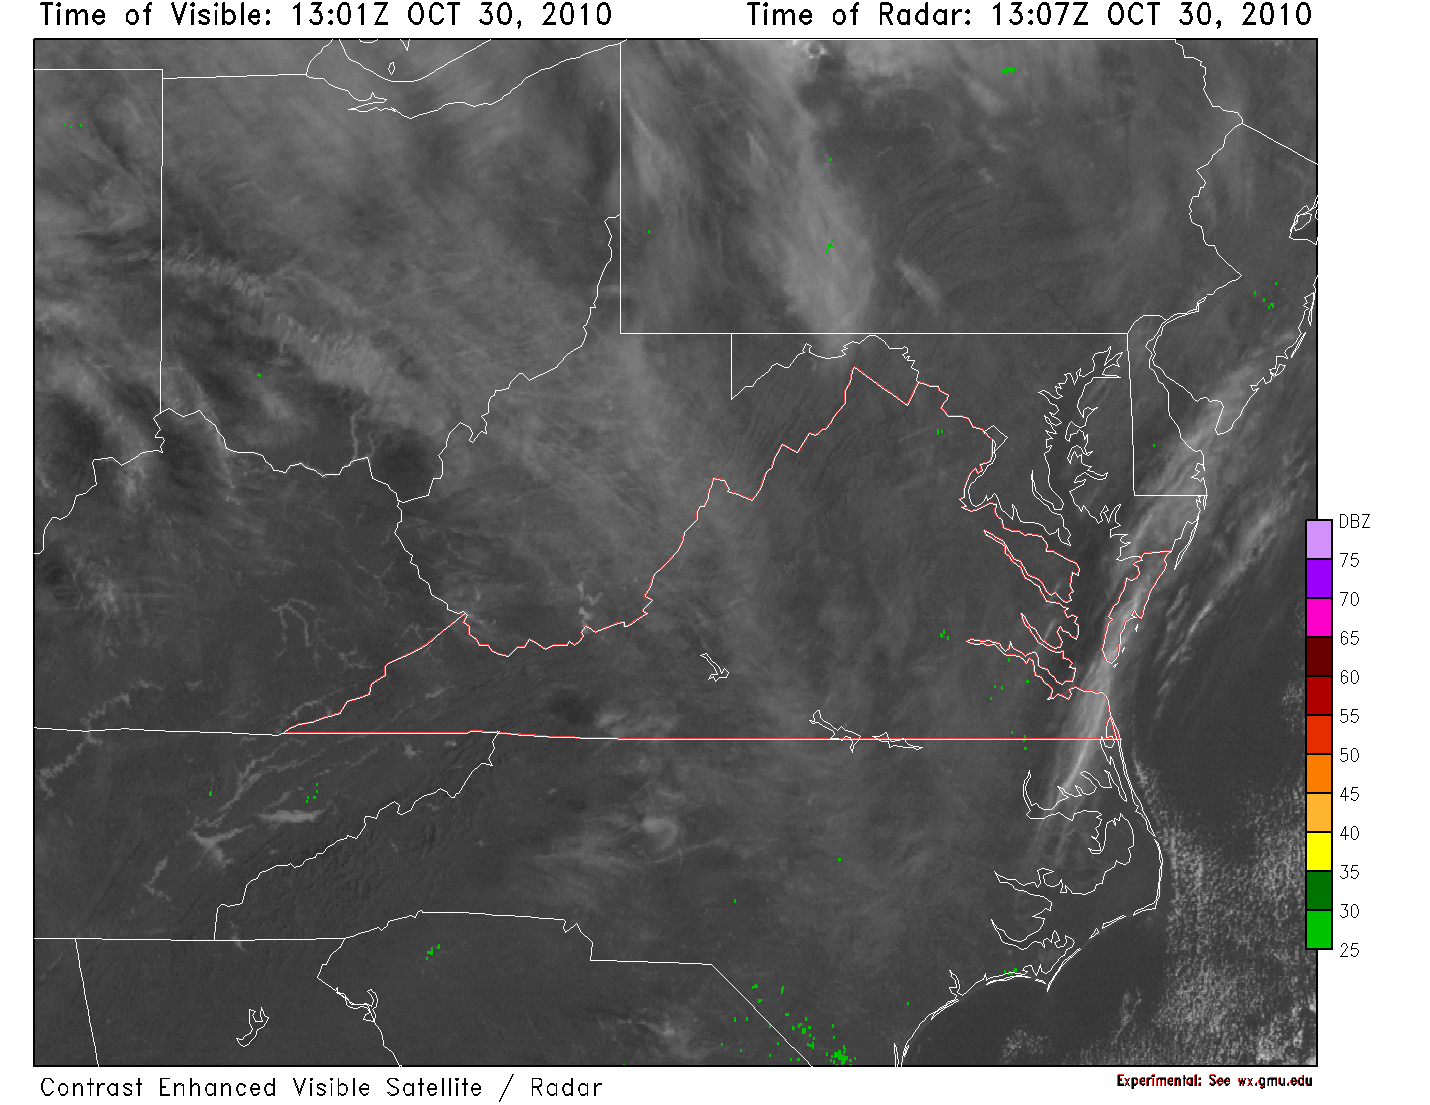
Looking at the current radar valid 8am, shown below, note the band of light precipitation to our east, extending north-south. Looking further below at the 500mb vorticity pattern valid for 8am, it can be seen that the band of precipitation stretches right along the strong shear vorticity lobe current overhead and just to our west, with the precipitation band in the area of highest PVA. Also note on the radar the precipitation further to the west, which is mostly of a showery (ie convective) nature. This precipitation is from the instability caused by the very cold temperatures aloft in the middle of the deep trough at 500mb. See the 8am 500mb temperature analysis shown further below.
Snow? Well, see below.
Looking at current conditions, the jet on the west side of the trough is causing it to deepen rapidly, carving out a very anomalous large trough extending into the deep south. Large scale lift and overruning to the east of the trough is causing widespread light rain over the eastern seaboard. The interactions of the various levels in the atmosphere is worth a close look with this system; use the tools on wx.gmu.edu to do so.
Unfortunately the radar data feed to wx.gmu.edu is not working this morning; below is a wide view of the radar from about 6am EDT.
Although the models are mostly shutting off the precipitation for our area this afternoon, it seems likely that we will get continue to get showers and/or drizzle through the night, until the 500mb vorticity maximum reaches our area. Below is the forecast 500mb vorticity pattern for tomorrow morning. Note the elongated shear vorticity maximum almost overhead at that time.
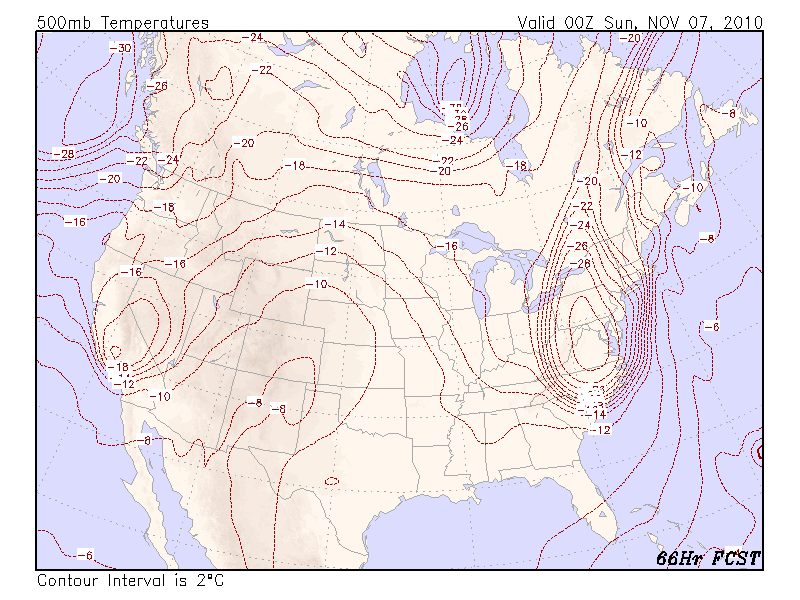
Also on Friday morning the 850mb temperature drops below zero and the 1000-500mb thickness drops below 540dm. This is cold enough for snow. Will there be enough lift or instability to generate some precipitation? The models close the upper trough off just a bit and move the center over our area later Friday into Saturday. Below is a plot of the 500mb temperature for late Saturday. Less than -30C at 500mb over us is very cold for this time of year! Should this take place, the atmosphere will be somewhat unstable, even with the cool air near the surface. And there will be available moisture at the surface, due to the rain falling now. It is not at all clear that we will see a few snowflakes here later on Friday or into Saturday -- but I would not be surprised to see it happen. It does appear quite likely that the mountains to our west will see accumulating snow during that period, given the additional lift provided by the terrain.
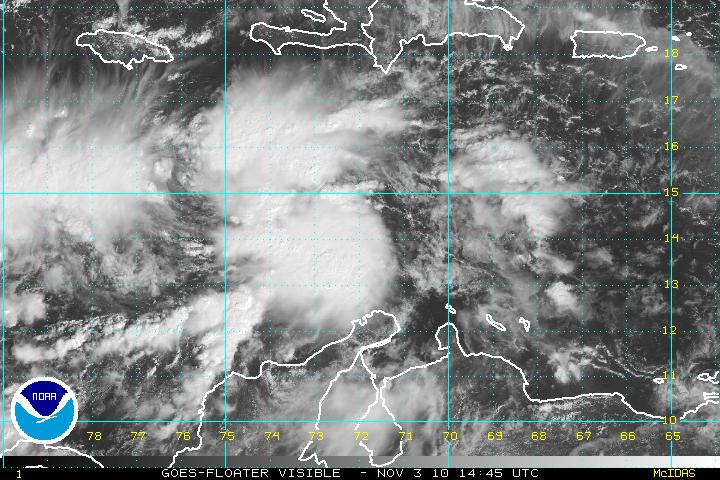
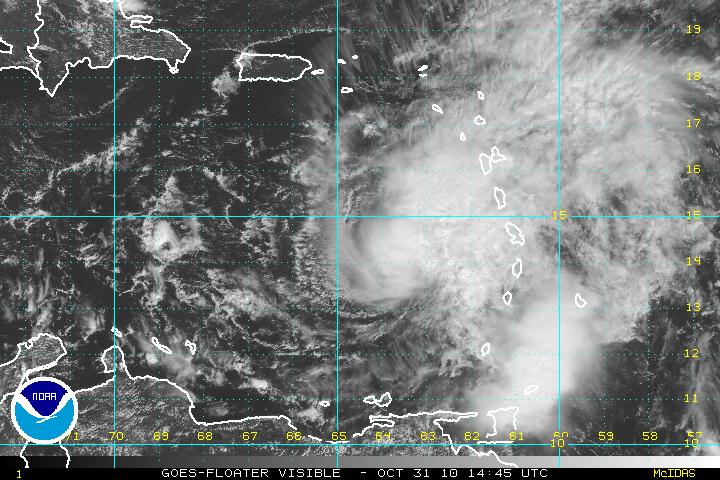
Thomas never strengthened as forecast, and today looks very disorganized. This demonstrates the difficulty of forecasting tropical systems in data poor regions.
After another clear and cold night, clouds are moving in from the southwest.
The forecast for the next few days is fairly complex. First looking at the 500mb chart for the last few days, we see the flow split as a wave moves south to the Gulf of Mexico and cuts off.
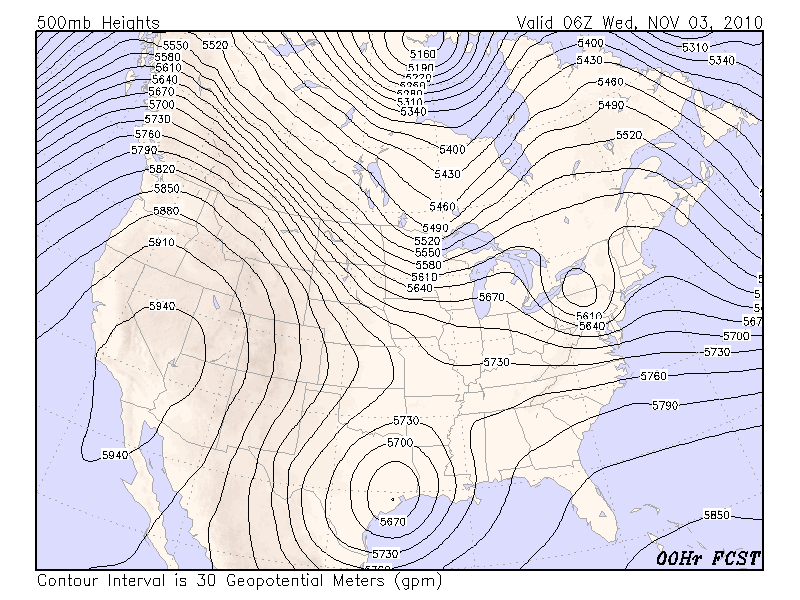
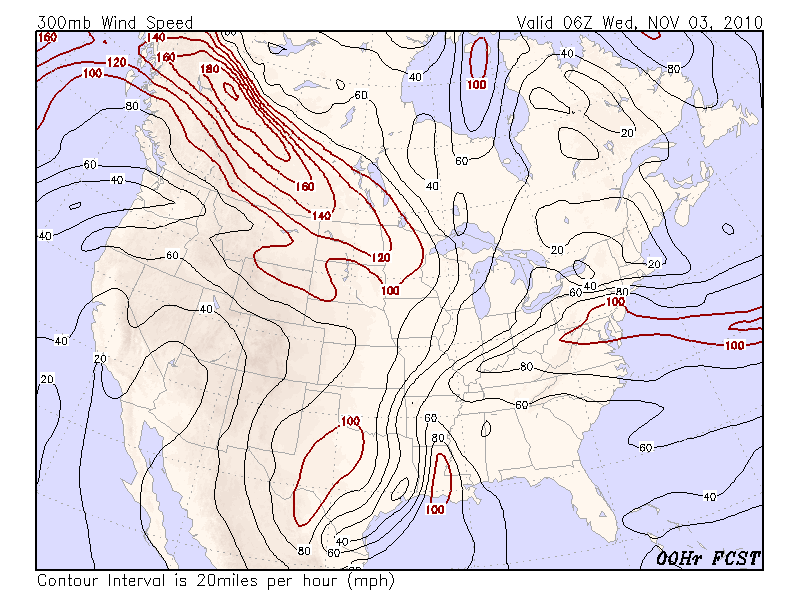
Also of note is the strong jet over southwestern Canada -- 200mph at the 300mb level.
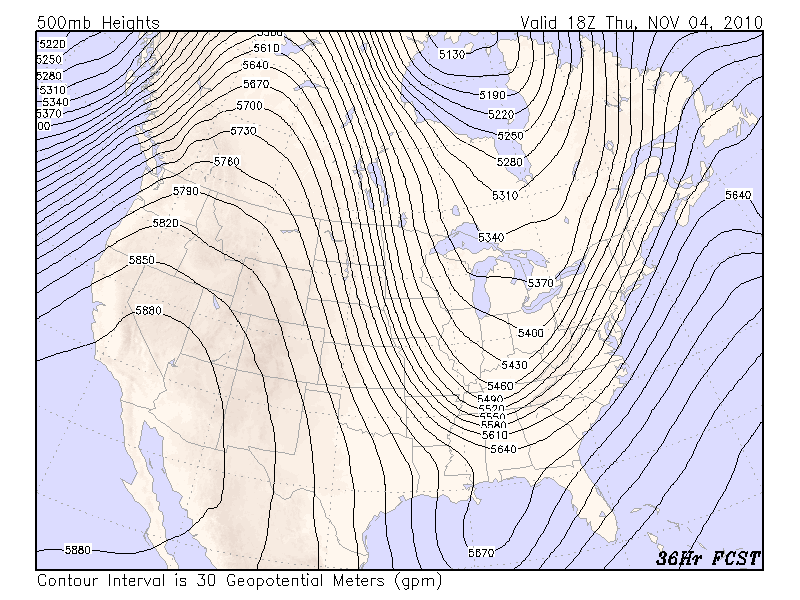
Energy out over the Pacific is forcing warm air northward off the west coast, building a large ridge. This in turn is re-orienting the jet stream over western North American to a more north-south orientation. This pushes the energy currently over southwestern Canada to the south more than to the east, and rapidly forms a large trough over the Eastern US, as can be seen by the 36 hour forecast for the 500mb height shown below. Note how the northern stream becomes dominant and begins to absorb the cut-off low over the western gulf.
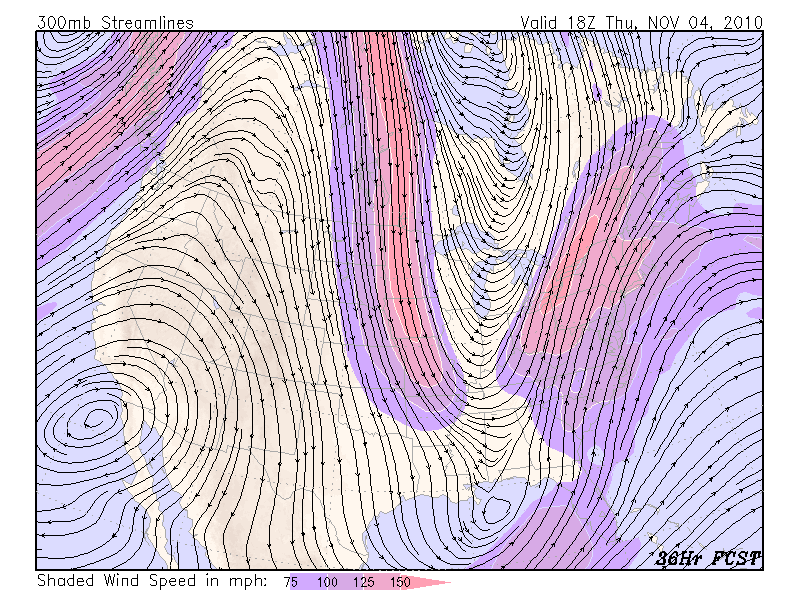
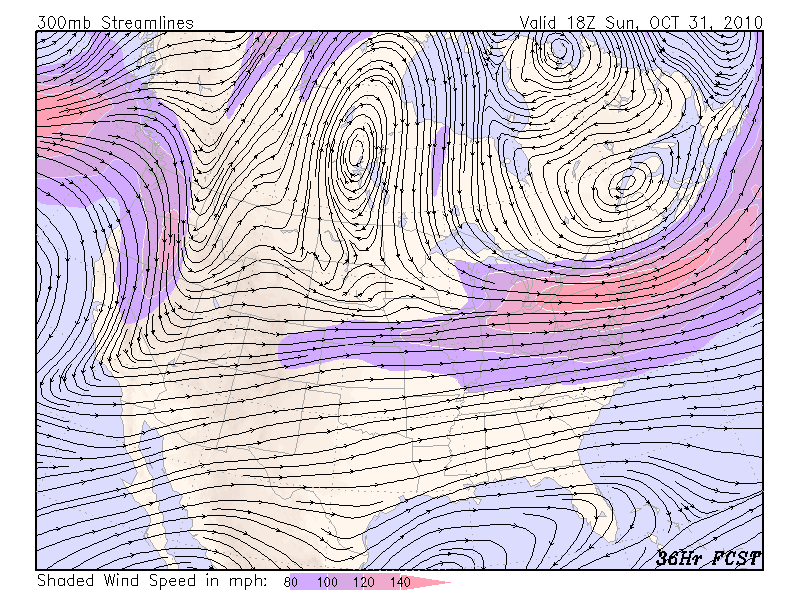
Looking at the 36 hour forecast, shown below, of the 300mb jets and streamlines, we see the strong jet on the west side of the trough, with its north-south orientation. We also see a jet forming on the east side of the trough, due to the increased pressure gradient forced by the deepening trough and by absorption of energy from the cut-off low over the GOM. Note the overall jet structure. There is a wind speed minumum at the base of the trough. The jets themselves have very little cyclonic curvature.
Also look at the vorticity pattern at 500mb for the 36 hour forecast:
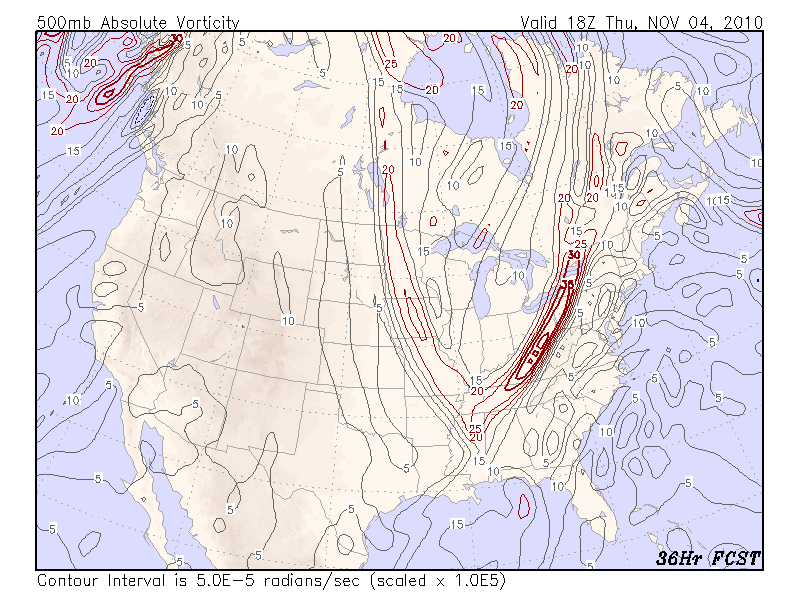
The vorticity pattern on the east side of the trough is stretched in a north-south pattern. This is typical of a shear vorticity pattern, where the vorticity is primarily being produced by the horizontal wind shear produced by the jet just to the east of the vorticity maximum. This sort of pattern does not produce very strong PVA.
Consider the jet stream structure, with the LFQ over southeastern Canada for the jet east of the trough, and the LFQ over the lower Missippi valley for the jet west of the trough. The RRQ is also a location for lift, with the RRQ for the east jet over the east coast, which is also an area of weak PVA from the relatively slow movement of the shear vorticity pattern. And the model 36hr forecast for SLP shows a weak low over the eastern seaboard:
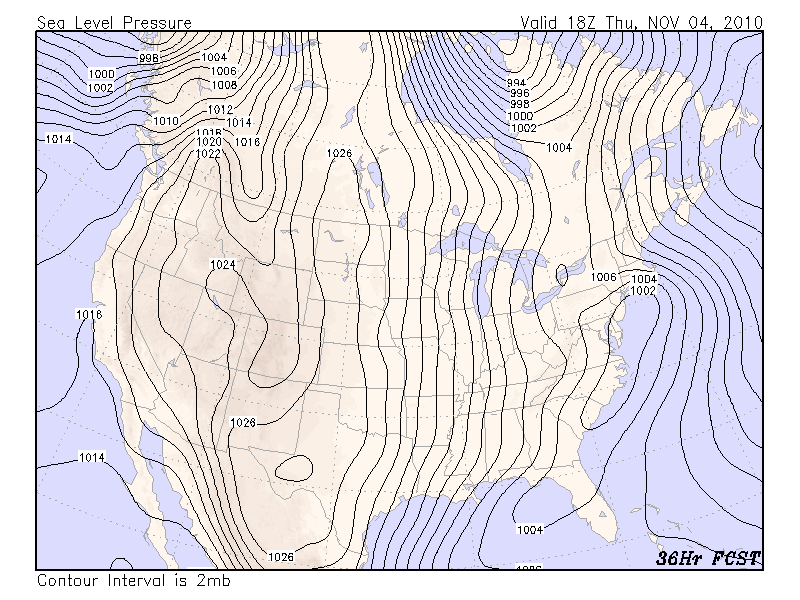
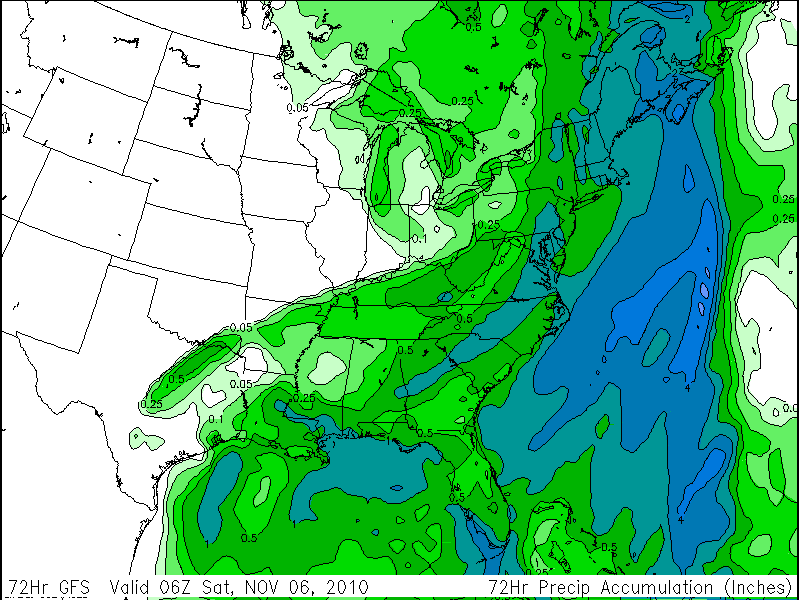
The absorption of the cut-off low over the GOM is absorbing energy and moisture into the northern stream, but much of that ends up going east. Some of the moisture does get pulled into the weak low pressure system along the eastern seaboard, sufficient for some light to moderate rain over our area as the low moves by on Thursday. Here's the model forecast for total 72hr precipitation through Friday night:
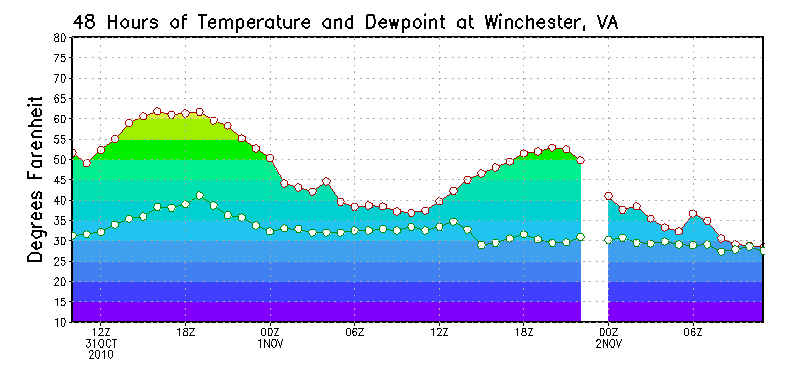
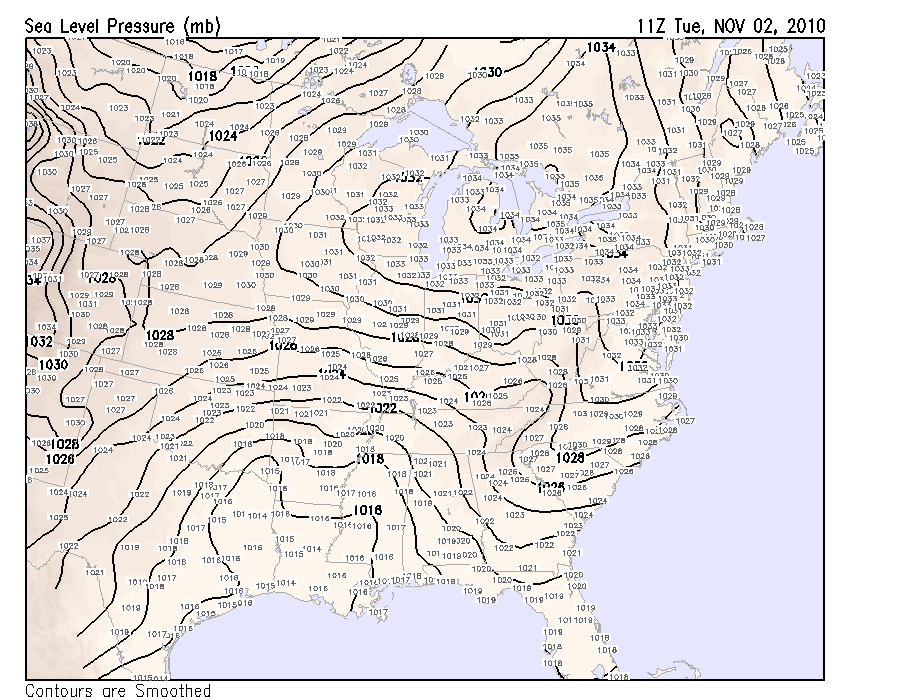
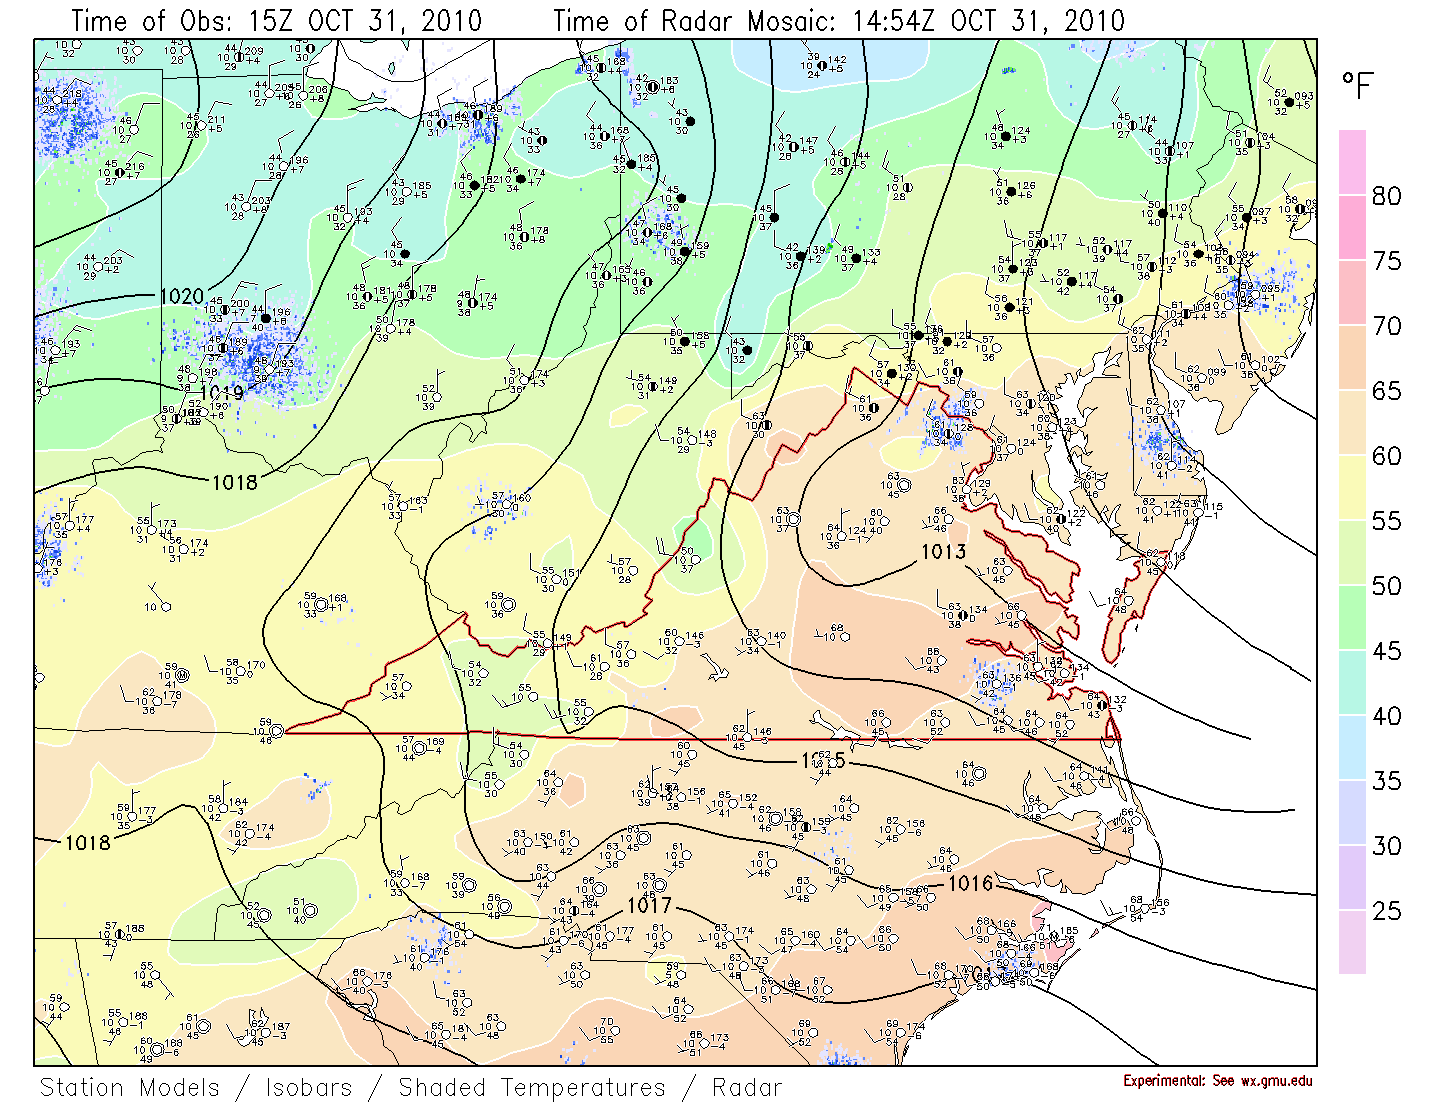
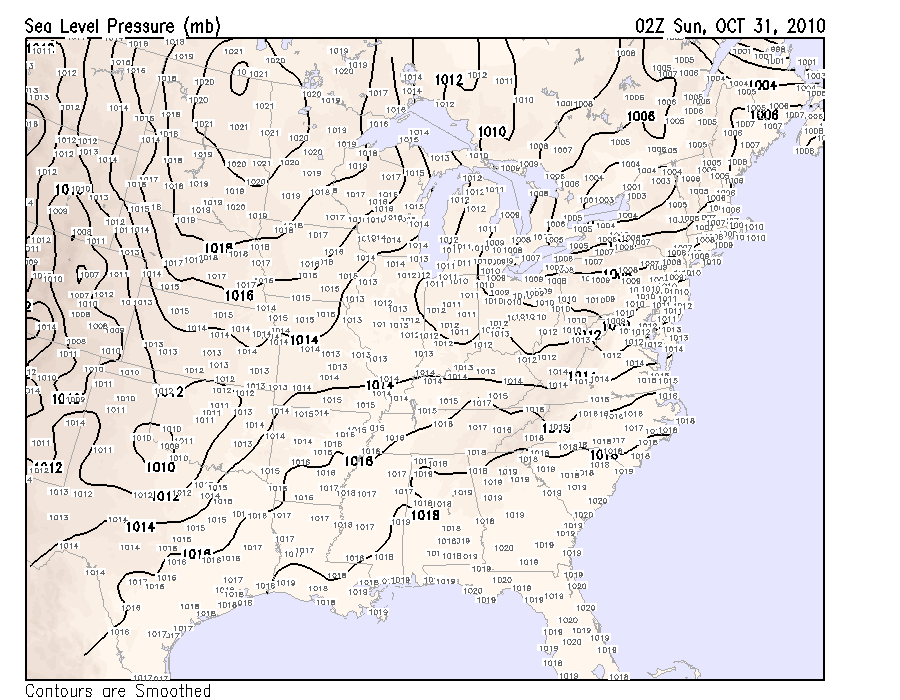
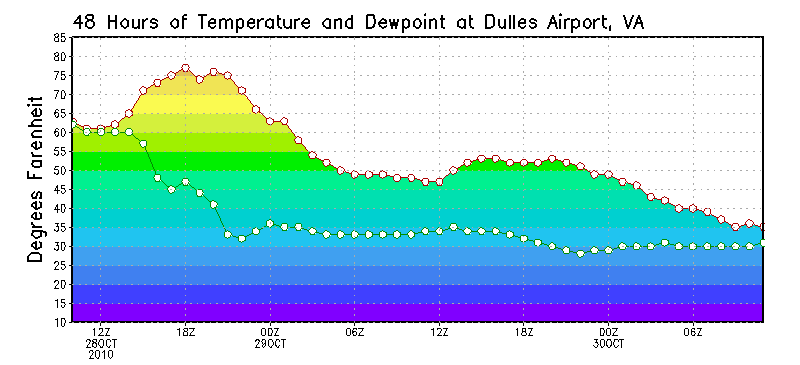
As expected, widespread frost and freezing temperatures this morning. Frost on the grass here in Falls Church, 32 degrees at Dulles, and out at Winchester it is 28 degrees. Look below to see that the temperature at Winchester fell to the dewpoint. Further below is the current SLP analysis. High pressure just to our north, with a ridge of higher pressure extending down the coastal plain, gives us mostly clear skies and calm winds. There is an area of high clouds just to our south, as predicted by the model forecast of RH at 300mb, but it is clear enough in our area for temperatures to drop close to the dewpoint, except in the urban heat island.
Thomas is looking much more ragged and poorly organized on the satellite this morning. NHC is still forecasting the hurricane to strengthen over the next few days.
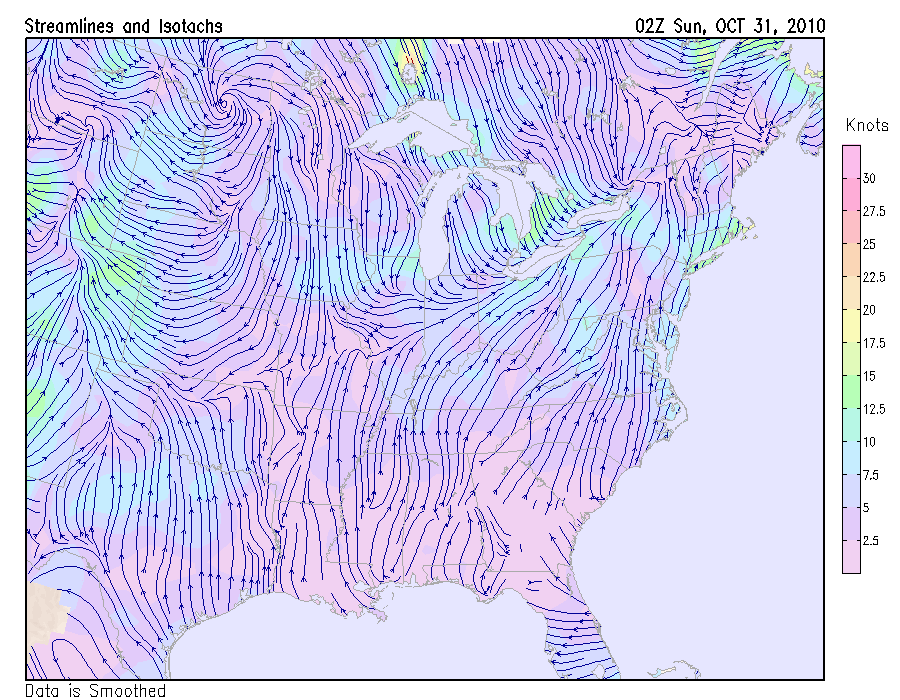
The current surface analysis shows the weak front moving through the area at this time. The sea level pressure analysis shows this most clearly, with a trough of low pressure extending from northern VA to the west-southwest. Winds have turned to the northwest. There's a lot of clouds over the mountains but weak downsloping should keep our area with at least some sun and moderate temperatures. High pressure builds in for the next couple of days with a risk of a widespread freeze tomorrow (Monday) night.
The computer models are showing an amplification of the pattern toward the middle of next week, with a deep trough forming over the eastern US. Reading the HPC medium range forecast discussion, they are saying that the ECMWF (European Center) and Canadian models are forecasting a deeper more defined trough that is also further west than what the GFS is currently forecasting. The HPC forecast for the 500mb height pattern for 12Z Friday Nov. 5 is below. This is a 6 day forecast. Skill at this forecast range is not very high. If this forecast verifies, the weather in our area late next week will be very interesting.
As we discussed in the lab on Friday, a weak front is moving south into the great lakes region, and it appears it will be passing through our area tomorrow, bringing a reinforcement to the cold air, with more risk of frost Sunday and Monday night. The temperature and dewpoint analyses do not show the front well, but the sea level pressure analysis and the surface streamlines both show the location of the front clearly, with it currently lying across Lakes Ontario and Erie and then running through central Indiana into S. Illinois.
High clouds continue to stream over our area, at times fairly thick. Looking at a time-height cross section of relative humidity, it can be seen that the GFS model is forecasting high relative humidity for the next day or so over our area. The 300mb wind analysis shows a strong jet to our north, strengthening and moving south over the next 36 hours. Continued high cloudiness, sometimes thickening, seems likely.
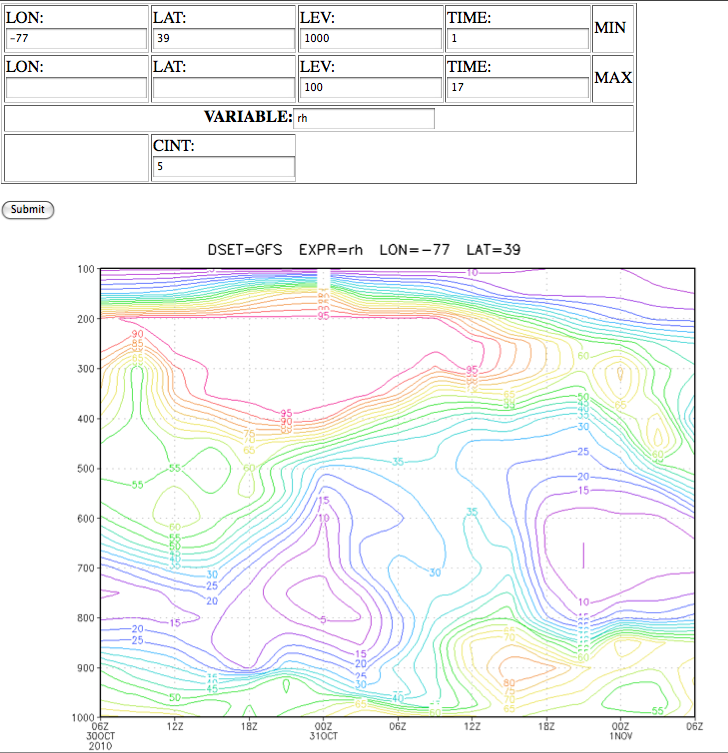
The above time-height cross section was produced with the Experimental Prototype Analysis Tool for GFS Data found in the Analysis Tools subheading on wx.gmu.edu. The cross section is drawn for a single point on the earth. In this case, the point is 77 degrees west and 39 degrees north. This is roughly over DC. The X axis of the plot changes with time, and the Y axis of the plot varies with pressure. (It is almost always called a time-height cross section, even though the Y axis coordinate is pressure.)
Thomas has a very nice presentation on the visible satellite this morning. Very symetric with nice outflow in all quadrants (except to the south). NHC is forecasting Thomas to be a major hurricane in a few days as it crosses the central Carribean. Will Thomas have an influence on the mid-latitude weather patterns over the US? It is too early to say, but the long range model forecasts suggest it won't.
Visible satellite verifies the presence of thin high clouds over our area. Note the fog in the river valleys in KY and TN.
Temperatures are trying to fall to freezing, but are not quite making it. Dewpoints are low enough -- note that at 7am the dewpoint at Dulles is 31 degrees.
But the temperature is 35 degrees, and has not been able to quite make it down to the dewpoint. Note that a shelter temperature of 35 degrees is cold enough for frost to form on vegetation (ie, grass) at near ground level.
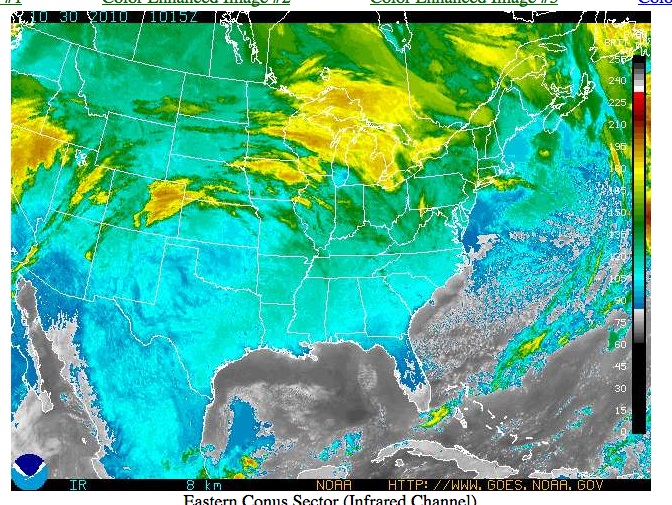
Taking a look outside, I see some color in the sky as the sun begins to rise. This indicates some clouds present. The IR satellite image also indicates the possibility of high clouds over northern Virginia:
The analysis of RH at 200mb for 06Z (2am) shows high values over our area.
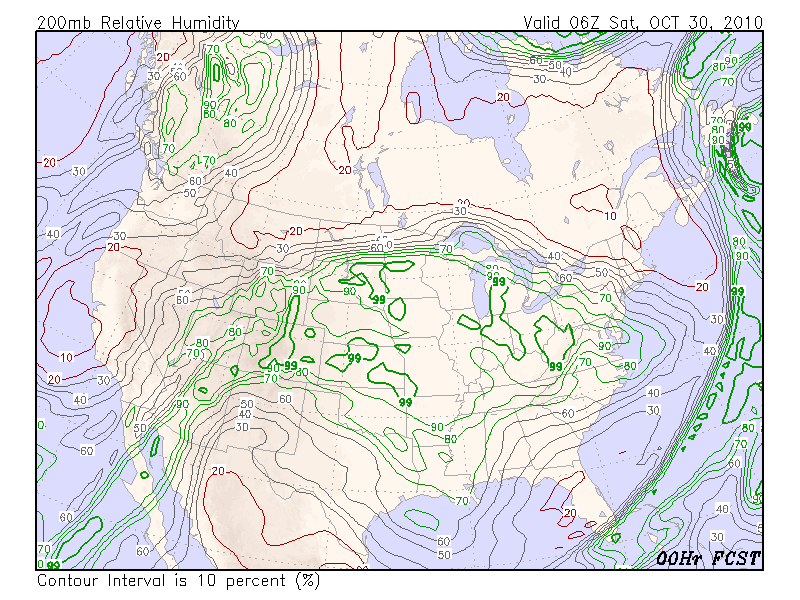
These high clouds are not very thick but are just enough to be blocking some of the outgoing longwave radiation and keeping some areas from getting frost and keeping most areas from getting below freezing. In hindsight, it would have been a good idea to have looked at the forecast RH values at the upper levels to help determine the potential for high clouds.
Again checking outside (here in Falls Church City), there is a nice thick layer of frost on the car (parked outside with sky exposure). The metal on cars radiates efficiently and frost will usually first appear on those surfaces. It does not appear that the near-ground vegetation here is going to get frosted this morning though.