| |
|
| |
|
| |
|
| |
Model forecasts for the eastern U.S. for the next
72 hours. 500mb heights, sea level pressure, precipitation, and 800mb temperatures
are some of the variables displayed.
|
| |
|
| |
|
| |
Over 600 maps of different levels, variables, and
forecast times produced from the GFS model data. The maps are easily accessible from
a single web interface. Maps are provided every 3 hours out to 36 hours. Updated every six hours.
This set of maps is available as soon as the first 36 hours of GFS model data is obtained.
See below for the same set of maps out to 144 hours, but available about an hour later.
|
| |
|
| |
|
| |
Over 1400 maps of different levels, variables, and
forecast times produced from the GFS model data. This is the same set of maps as above, but
go out to 144 forecast hours. The maps are easily accessible from
a single web interface. Use the dropdown menu to select maps for every 3 hours, 6 hours, or 12 hours.
Updated every six hours.
This set of maps is not available until all of the GFS model data is obtained.
|
| |
|
| |
|
| |
Forecasts made by the National Weather
Service and digitally encoded on the NDFD grids. NDFD stands for National Digital
Forecast Data. Coming soon!
|
| |
|
| |
|
| |
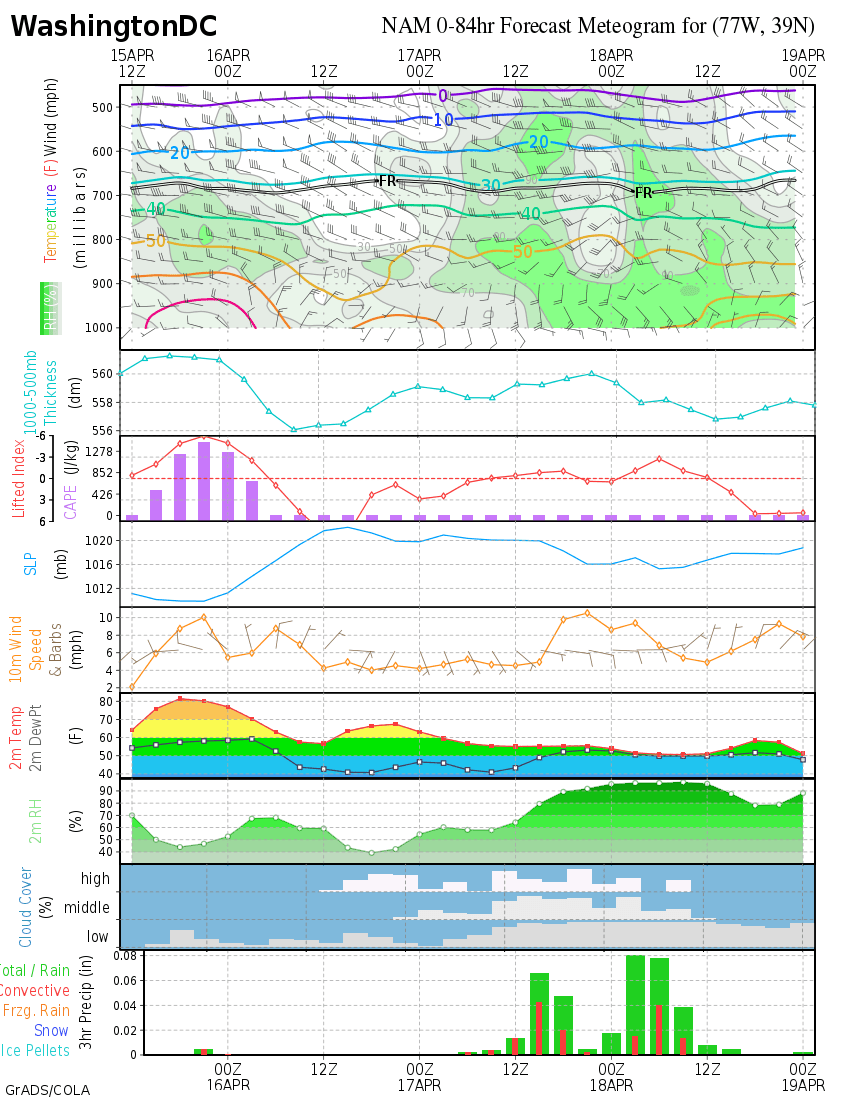
Meteograms for selected cities in
and near Virginia. Click on the appropriate box for the meteogram.
|
| |
|
| |
|
| |
Daily GFS forecast summaries for 7 days.
The plots show 500mb heights as solid white contours, Sea Level Pressure as colored
contours, and accumulated precipitation as colored shading. Note that while the
500mb heights and SLP are instantaneous fields at the valid time, the precipitation
is a 24 hour forecast accumulation ending at the valid time.
|
